
Are We in an AI Bubble? What Overcrowded Tech Trades and Falling Rates Mean for Real-Asset Investors
The global investment narrative has shifted noticeably in recent months. Artificial intelligence still dominates headlines, but the conversation has matured. Investors are no longer debating whether AI will reshape industries. They are questioning how much of the future has already been priced in, and what that means for returns in the present cycle.
A small group of AI-linked mega cap companies now represent an unusually large share of global equity performance and passive fund flows. Their valuations rest on extraordinary expectations and on an unprecedented wave of capital spending. More than three hundred billion US dollars is expected to flow into data centres, GPU clusters and cloud infrastructure over the coming year. This investment is real. It appears as demand for land, power, logistics, construction labour and specialised industrial assets.
At the same time, the macro environment is becoming more complicated. Labour markets in major economies are softening. Central banks are preparing for the possibility that productivity gains from AI may not fully offset job displacement in the short run. Rate cuts are re-entering the global conversation. New Zealand is already well into an easing cycle. Malaysia remains neutral for now but has room to adjust. The common thread is that policy makers want to support growth without reigniting inflation.
For real estate investors, this creates an unusual landscape. Parts of the equity market look stretched, while income-producing assets are becoming more attractive as borrowing costs ease and yield spreads widen. The risk lies in chasing speculative stories. The opportunity lies in owning the physical assets the AI buildout depends on.
This report focuses on those dynamics and what they mean for Fairhaven’s strategy.
This month’s edition covers:
Why AI concentration risk is rising and how it affects broader market stability
How circular financing and mega cap capital expenditure shape the real economy
The latest monetary and labour market signals from New Zealand and Malaysia
How real estate is absorbing AI infrastructure spillover in both regions
Why yield is regaining primacy as the core driver of total return
Live institutional-scale opportunities aligned with these long-term themes
1. AI Optimism, Concentration Risk, and the Illusion of Growth
Investor sentiment toward artificial intelligence remains overwhelmingly positive, but the underlying market structure is beginning to show signs of imbalance. The world is not questioning whether AI will be transformative. The question is whether the pace of equity gains reflects genuine economic output or whether price levels have run ahead of fundamentals.
A small group of technology giants now accounts for a disproportionate share of global equity performance. Roughly forty percent of every dollar in a standard S and P 500 index fund now flows into the ten largest companies, many of which are positioned as beneficiaries of AI. Nvidia alone attracts close to eight percent of all passive inflows. This level of concentration is unusual. Outside the late 1990s, global markets have rarely depended so heavily on such a narrow group of firms.
This concentration matters because it shapes both risk and perception. The valuations of these firms assume that AI will become one of the most profitable economic engines in history. To justify current market prices, analysts estimate that the leading AI players would need to generate close to two trillion US dollars a year in combined revenue. In 2024, even the largest technology companies together did not reach that threshold.
The enthusiasm is supported by enormous capital spending. More than three hundred billion US dollars is expected to be deployed into data centres, GPU farms, submarine cables and cloud infrastructure over the coming year. This investment is not theoretical. It is visible in land absorption, power consumption, grid expansion and logistics demand across the United States, Europe and Asia.
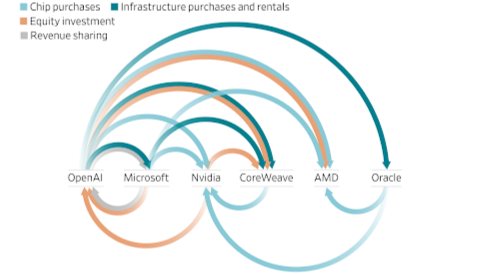
Yet a growing share of this activity is being funded through complex capital structures. Private credit facilities, structured vehicles, circular financing arrangements and joint ventures allow companies to scale rapidly without fully reflecting the associated liabilities on balance sheets. Revenue flows between AI developers, cloud operators and hardware suppliers often cycle through the same ecosystem, creating an appearance of accelerating growth even when free cash flow remains thin.
This circular financing model is not inherently unstable, but it does increase sensitivity to any slowdown in capital flows. If the cost of capital rises, if policy support weakens or if revenue expectations are revised lower, the feedback loop can lose momentum quickly. That is why veteran investors like Warren Buffett and Michael Burry have reduced exposure to these names. Their decisions do not imply an end to the AI story. They reflect concern that the price of the story has raced ahead of the underlying economics.
The broader implication is straightforward. When market valuations depend on expectations that stretch far into the future, the stability of income in the present becomes more valuable. This is the pivot point for real estate investors. The goal is not to bet against AI. The goal is to recognise that the physical infrastructure supporting AI is being built now, while equity returns may take years to normalise.
AI may be the narrative that drives headlines. Cash flow is still the foundation that supports portfolios. It is the difference between an economy powered by hype and one grounded in real demand.
2. The AI Trade: Concentration, Circular Financing, and Real-World Risk
The story of this cycle is often told as an AI revolution. The numbers behind it tell a slightly different tale. What we are really seeing is a massive concentration of capital, a feedback loop inside a handful of companies, and a growing gap between market expectations and current cash flows.
For real asset investors, this matters. When listed markets price in perfection, the margin for error shrinks. Understanding how this AI trade is structured helps explain why yield, cash flow, and real assets are gaining renewed importance.
How Capital Quietly Piled Into AI
Most investors did not consciously decide to make a large bet on AI. The bet was made for them.
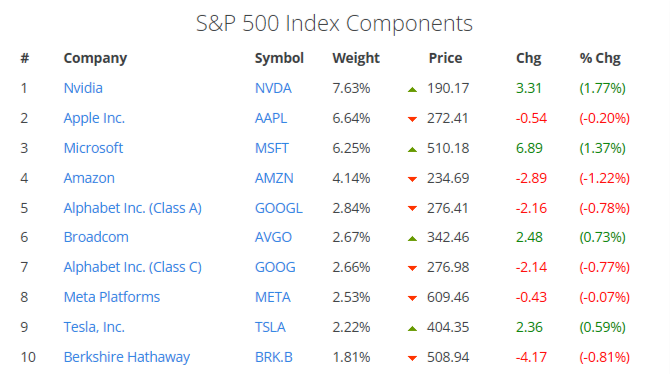
The S&P 500 is a market capitalisation weighted index. As the largest technology and AI linked firms rallied, they became an outsized share of the benchmark. As of late 2025, the top ten companies in the S&P 500 account for close to 40% of the entire index by weight, with names such as Nvidia, Microsoft, Apple, Alphabet and Amazon at the core of that group. The result is that every contribution into a simple index fund sends a disproportionate share of each dollar into a small cluster of AI exposed firms.
Layered on top of that is the capex cycle itself. Analysts now estimate that global AI and cloud leaders will spend hundreds of billions of dollars per year on data centres, chips, and supporting infrastructure through the middle of this decade. The optimism baked into current equity valuations implies that this investment will eventually translate into roughly two trillion dollars in annual revenues from AI related activities.
The problem is timing. Revenue has not yet caught up with the capital being deployed. The market is already pricing AI as if it will become one of the most profitable engines in corporate history, long before the income statement reflects it.
Circular Financing: Growth That Feeds On Itself
One reason the AI story feels so powerful is that everyone involved appears to be growing at once. Part of that growth is genuine. Part of it is the result of circular financing.
The basic loop works like this. A highly valued AI hardware or platform company invests in a model developer or cloud partner. That partner then signs large, long dated compute contracts with hyperscalers. The hyperscalers, in turn, order more high end chips and infrastructure from the original hardware vendors. Each participant can point to rising order books and backlogs. Each can justify higher spending and higher valuations.
From a distance, it looks like broad based demand. In reality, a portion of that demand is being recycled within the same ecosystem. Profits are supplemented with cheap financing and off balance sheet structures such as private credit lines, joint ventures, and special purpose vehicles. In accounting terms, the line between cash generated from operations and cash raised to fund expansion becomes blurred.
This does not mean the AI build out is fictitious. Physical data centers are being constructed and servers are being installed. What it does mean is that a significant share of the current growth is being underwritten by future assumptions rather than present cash. If those assumptions are even slightly too optimistic, the adjustment can be sharp.
When Expectations Outrun Fundamentals
Two signals from this year have caught the attention of long term investors.
The first is leadership behaviour. Some of the most experienced allocators, including large value investors, have been quietly raising cash rather than leaning further into the AI rally. They are not necessarily predicting collapse. They are signalling discomfort with paying current prices for future earnings that remain uncertain.
The second is the scale of the promises being made. Public commitments of more than one trillion dollars in potential AI infrastructure spending over time may be directionally plausible, but they sit uncomfortably alongside current revenues that are still measured in tens of billions. When executives begin talking about the need for eventual public sector backstopping or government support, markets rightly ask how much of the current capex cycle is sustainable on a purely commercial basis.
In other words, AI may well transform the economy, just as the internet did. That does not guarantee a smooth path for current equity holders. The dot com era offers a useful parallel. The technology thesis was ultimately correct. The valuations at the peak were not.
Why This Matters For Yield And Real Assets
For real estate and income investors, the key insight is simple. A large share of global equity returns is now reliant on a narrow band of AI beneficiaries whose valuations assume perfect execution for many years ahead. At the same time, a significant portion of their current expansion is funded with leverage and circular commitments.
If that expansion slows, the risk does not stay confined to a few tickers. It ripples through index funds, retirement accounts, and broader sentiment. Financial conditions can tighten quickly if markets decide that expectations need to be reset.
Against that backdrop, the appeal of assets that do not rely on heroic assumptions becomes clearer. A logistics warehouse on a long lease, a student accommodation block with visible occupancy, or an industrial estate serving an emerging tech corridor all generate cash today. Their value comes from contractual income, not from the promise of distant network effects.
AI still matters in this story, but in a different way. Rather than chasing the headline names, investors can seek exposure to the physical infrastructure that AI requires to function. Power served land, warehousing near cloud regions, and housing in growth corridors tied to technology employment can all benefit from the build out, while still being anchored by traditional real asset cash flows.
That is the lens we use in the rest of this report. We treat AI less as a speculative trade and more as a structural demand driver that will intersect with local macro conditions in places like New Zealand and Malaysia. In a world where expectations at the top of the market are stretched, yield and durability at the asset level matter more than ever.
3. What Happens When Liquidity Turns: The Macro Picture for 2025–2026
The AI boom is happening at the same time the global liquidity cycle is shifting. For almost two years, markets have been pricing in the idea that central banks would eventually ease. That moment is now arriving, but not for the reasons most people expected. Underneath the strong headline numbers and market optimism, the economic signals point to something more fragile. Understanding this shift is important because it determines which asset classes thrive and which ones turn volatile.
US Liquidity: The Engine Behind Global Risk Appetite
The Federal Reserve remains the world’s largest source of financial gravity. When it expands or contracts liquidity, every risk asset from equities to property responds. Through 2024 and most of 2025, the United States operated under quantitative tightening. The Fed allowed Treasury and mortgage-backed securities to roll off its balance sheet, removing liquidity from the system. That cycle was expected to continue until mid-2026.
However, in October the Fed signalled that quantitative tightening would end much earlier than forecast. On paper, this should have been supportive for markets. In practice, the announcement triggered a different reaction. Investors interpreted the early end to tightening not as confidence but as caution. Historically, the Fed has only ended tightening prematurely when it detects stress. The market began asking the uncomfortable question: where is the stress point this time?
A revealing detail lies in the labour market. US job openings have fallen for seven consecutive months. Wage growth is flattening. Temporary employment, often a leading indicator, has declined sharply. At the same time, corporate profit margins outside the AI sector have compressed. Beneath the surface, credit conditions are tightening faster than headline rates suggest.
This has created a divergence between the economy that is visible in data and the one being priced by markets. Technology stocks have soared, but consumer credit, small-business hiring intentions, and freight volumes have weakened. That divergence is only sustainable while liquidity is flowing into the top ten companies that dominate the S&P 500. If liquidity slows, valuations that depend on circular AI financing become exposed.
Europe and Asia: Weak Growth, Strategic Realignment
Across Europe, growth momentum remains soft. The eurozone entered 2025 with GDP expanding at barely 0.5 percent. Germany is still struggling with an industrial recession. France and Italy are stabilising but not accelerating. High energy costs and slow productivity recovery continue to weigh on investment.
Asia presents a more mixed picture. Japan’s economy remains supported by corporate investment and inbound tourism, but consumer spending is weakening. China continues to face structural headwinds, including a housing market that has not stabilised and local governments that rely heavily on land sales. Manufacturing surveys show persistent contraction, and import demand has not recovered.
These global conditions matter because they limit the upside for growth-led investment strategies. They increase the value of assets with strong yield, predictable tenancy, and low sensitivity to speculative cycles. In this environment, cash flow matters more than capital gain.
Why This Environment Favours Real Assets
The world is entering an unusual moment where technology-driven optimism coexists with macroeconomic fragility. This combination strengthens the argument for real assets.
Income-producing property behaves differently from growth equities when liquidity tightens. Rents are contractual. Occupancy in industrial, logistics, and managed residential sectors tends to remain stable, especially in markets with supply constraints. When interest rates fall, the value of stable yield becomes more pronounced because the spread over the policy rate expands.
This is the heart of the opportunity for both New Zealand and Malaysia. Both countries offer income yields of 6 to 8 percent on high-quality industrial and residential assets. These yields clear domestic inflation and create a buffer against tightening liquidity in global markets. In addition, both markets are benefiting from AI-related spillover that is driving structural demand for power, land, logistics space, and workforce accommodation.
4. New Zealand: Yield Strengthening Into the Easing Cycle
New Zealand has entered a clearer phase of monetary transition. After two years of deliberate tightening, the Reserve Bank’s move to reduce the Official Cash Rate to 2.5 percent signalled a pivot toward supporting growth. What makes this shift important is not only the cut itself but the broader macro context around it. Inflation is stabilising, wage pressures are easing, supply constraints remain persistent, and new infrastructure cycles are beginning to take shape around Auckland’s technology corridor.
The combination of lower rates and constrained supply creates conditions that historically lead to yield compression. For investors, this is the moment where dependable income becomes more valuable, not less.
Monetary Conditions: The Foundation for a Slow Recovery
Inflation has now returned to within the central bank’s target band. Annual CPI came in at 2.7 percent for the June 2025 quarter, helped by a decline in imported inflation and moderated wage growth. Tradables inflation has softened due to normalised global freight rates and stable fuel costs. Non-tradables remain elevated in categories such as food and insurance, but the overall trend is downward.

With the OCR at 2.5 percent, real short-term rates are effectively neutral. The Reserve Bank has indicated that another 25-basis-point reduction may occur in early 2026, which would bring the policy rate toward 2.25 percent before stabilising. This is not an aggressive easing cycle. It is a controlled glide, designed to support demand without reigniting inflation. Historically, these are the conditions under which real assets experience orderly re-pricing rather than volatile swings.
What matters for investors is the expanding spread between borrowing costs and income yields. A property producing a 6 to 7 percent net yield now sits several percentage points above both inflation and debt costs. That margin is the basis for sustained interest in industrial, logistics, and managed-residential sectors.
Growth, Labour, and Real Activity
New Zealand’s economic outlook has steadied. GDP grew 0.8 percent in the March 2025 quarter, reversing the contraction seen in late 2024. Forecasts from the NZ Institute of Economic Research suggest annual growth of around 1.5 percent through March 2026, supported by exports, construction activity, and service-sector stabilisation.
The labour market has loosened at a contained pace. Unemployment sits at 5.2 percent, easing wage pressure while maintaining overall labour participation. This is a favourable environment for property operators. Slower wage inflation helps stabilise construction and facilities-management costs, while continued employment supports tenancy resilience across residential and commercial stock.
Forward indicators provide further clarity. Business confidence surveys show sentiment moving gradually from negative to neutral. Hiring intentions remain cautious but no longer in decline. Consumer activity is stabilising, helped by lower mortgage rates and easing price pressures. None of these elements point to a rapid acceleration, but they position the economy for a measured recovery.
Housing and Construction: Supply Tightening Into Lower Rates
The housing market continues to hold steady despite a prolonged period of higher interest rates. While seasonal fluctuations remain visible, price levels have largely stabilised. The REINZ House Price Index rose 0.1 percent year on year in August, although national median prices declined 1.3 percent month on month. Volumes remain soft, but the pace of decline has slowed noticeably compared to the start of the year.
The more important shift is in supply. New residential construction is cooling in a controlled but decisive manner. Using the latest data from Stats NZ, annual dwelling consents have eased across almost every category since their 2021 peak. The reduction has been most significant in stand-alone houses and retirement village units, while apartments and townhouses continue to moderate from earlier highs.

This data confirms a clear trend. After construction peaked between 2021 and 2022, activity has steadily declined through 2023 and 2024. For 2025, the early-year trajectory suggests stabilisation rather than a renewed downturn, but at materially lower levels than the previous cycle. Over the period from January 2023 to August 2025, average monthly consents have fallen from above 3,900 units to closer to 2,800 units. July 2025 recorded 3,252 consents while the August estimate sits at approximately 3,080. Annualised volumes near 34,000 units are only slightly below the prior year but well under the peak years.
This decline is not a demand shock but a credit and cost adjustment. Developers remain hesitant to commence new supply while funding remains cautious and margins thin, especially for higher-density projects. At the same time, construction cost inflation, though moderating, remains elevated compared to pre-pandemic averages, which has slowed feasibility across many sites.
The timing of this supply contraction matters. It is occurring just as monetary conditions begin to ease. With the Official Cash Rate reduced to 2.5 percent and likely to move toward 2.25 percent by early 2026, financing conditions will gradually support new activity. Historically, the combination of lower rates and reduced new construction is a precursor to valuation firming. As supply tightens and borrowing costs fall, income-producing assets tend to strengthen because landlords regain pricing power and investors face fewer competing development pipelines.
For the current cycle, this creates a favourable setup for yield-led recovery. Industrial, logistics, and managed residential assets benefit most from this environment, as vacancy remains low and demand drivers linked to population flows, technology infrastructure, and service-sector growth continue to hold. As credit costs ease, these assets are well positioned for cap-rate compression through 2026.
Sectoral Impact: Where Opportunity is Concentrated
Industrial and logistics remain the standout performers. Occupancy in Auckland and Hamilton exceeds 95 percent, driven by structural demand from warehousing, distribution, and the emerging needs of data-centre and cloud-service operators. Net effective rents have risen about 3 percent over the past year, supported by limited new supply and consistent tenant retention.
Student and workforce accommodation is benefitting from international enrolment recovery and the influx of specialised contractors associated with technology-infrastructure projects. These assets offer defensive occupancy and strong cash flow, especially when located near transport nodes and university precincts.
Aged care and healthcare continue to attract institutional interest. Demographic pressure supports long-term demand, and stabilising debt costs improve operator margins. These assets also align with ESG-driven mandates now influencing private and sovereign capital.
Office and retail remain uneven. Suburban and transit-oriented offices show signs of stabilisation, while lower tier stock continues to face structural pressure. Retail performance depends heavily on catchment strength, but nodes with population growth and mixed-use integration are holding firm.
The Fairhaven View
New Zealand is entering a yield-led cycle. The combination of easing rates, moderating inflation, and constrained supply creates a backdrop where income assets are positioned to outperform. Investors are being paid to hold yield again. As the OCR trends toward 2.25 percent in early 2026, the likelihood increases that cap rates will tighten, particularly for industrial, logistics, and workforce housing near Auckland’s growing technology ecosystem.
The opportunity lies in securing dependable cash-flow assets before price expectations adjust. The next twelve to eighteen months are likely to define the inflection point for this cycle. If inflation remains controlled and monetary easing continues as expected, real assets in New Zealand may be entering one of the most orderly re-rating phases in a decade.
5. Malaysia: A Growth Cycle Accelerating Under the AI Build-Out
Malaysia enters 2026 with momentum that stands in contrast to the slowdown in many advanced economies. Where New Zealand’s story is about a gentle easing cycle, Malaysia’s story is about structural demand: regional supply-chain realignment, renewed foreign direct investment and the early stages of AI spillover from Singapore and the global hyperscalers. These forces are reshaping industrial corridors in Johor, Klang Valley and Penang, and are creating one of the strongest income environments in Southeast Asia.
The country’s positioning is still distinctive. It offers relatively affordable power, scalable industrial land and immediate proximity to Singapore at a fraction of the cost. That mix has pulled Malaysia into the front line of the next phase of data centre and cloud region expansion.
Monetary and Fiscal Landscape: Now Gently Supportive
Malaysia’s macro base is stable and, after the latest policy move, quietly supportive of growth. Bank Negara Malaysia kept the Overnight Policy Rate at 3.00 percent from May 2023 until July 2025, when it delivered a pre-emptive 25 basis-point cut to 2.75 percent to underpin domestic demand against a softer global backdrop. The rate has been held at 2.75 percent at the September and November 2025 meetings, with the Monetary Policy Committee signalling that this level is consistent with sustainable growth and low inflation, while leaving the door open for further action if downside risks emerge.
Headline inflation has eased meaningfully. Price growth averaged close to 2 percent through 2025, near the lower end of Bank Negara’s projected range, as energy and food pressures moderated and subsidies were gradually retargeted. Real short-term rates are therefore modestly positive, yet still low enough to support credit growth and investment.
Growth has surprised to the upside. Malaysia’s economy expanded by 5.2 percent year on year in the third quarter of 2025, an acceleration from earlier in the year, driven by private consumption, manufacturing exports and solid services activity. Forward guidance from both the central bank and independent forecasters points to full-year growth in the 4 to 5 percent range, with risks tilted toward the lower side if external demand weakens further.
On the fiscal side, higher tax receipts and firm petroleum income have helped narrow the deficit, while the development budget has stayed focused on digital infrastructure, transport links and energy transition. These projects increase the long-term “floor” under demand for industrial, logistics and urban residential space.
Taken together, this mix of low but positive inflation, an OPR at 2.75 percent and steady growth gives Malaysia a clear advantage. Investors can access relatively high income yields without the interest-rate volatility seen in many other emerging markets.
The AI Spillover: Johor’s Shift From Manufacturing to Compute
Johor has become one of the most closely watched states in the region. Over the past two years it has attracted a wave of commitments linked to data centres and AI infrastructure. NVIDIA’s tie-up with YTL Power to build an AI data centre park in Kulai, with planned investment estimated at about 20 billion ringgit, is the flagship example. Microsoft has announced a 2.2 billion US dollar plan to develop cloud and AI infrastructure and a new data centre region in Malaysia, while Google has committed a further 2 billion US dollars to digital infrastructure and cloud expansion.
Much of this capacity is being pulled south from Singapore, where grid and land constraints are binding. Johor offers what the city-state currently cannot: scale, power headroom and cost efficiency. Grid upgrades in Sedenak and the Iskandar region, new fibre routes and special economic zone initiatives with Singapore are laying the foundations for a compute-heavy economy.
For property investors, the key is the ecosystem rather than the server halls themselves. Every hyperscale facility needs component staging warehouses, cold and secure storage, logistics hubs, contractor accommodation and long-stay housing for technical staff. Market reports already show tightening vacancies and firmer industrial rents in Johor’s principal logistics parks, with Knight Frank and other brokers highlighting strong take-up in data-centre linked locations. This is where yields remain most attractive while re-rating is still in its early phase.
Klang Valley: National Logistics Hub With Digital Tailwinds
Greater Kuala Lumpur continues to function as Malaysia’s domestic demand and distribution engine. Klang Valley’s industrial estates sit at the intersection of the country’s largest consumer base, Port Klang, two international airports and key expressway links.
Recent agency research points to healthy warehouse absorption and gradually rising prime rents, driven by e-commerce fulfilment, third-party logistics and semiconductor and electronics supply chains. As AI hardware flows through the region, these corridors act as staging points for imports and regional redistribution.
At the same time, the urban residential market in central Kuala Lumpur is stabilising after a multi-year correction. Locations such as KL Sentral, Bangsar South and Brickfields continue to see resilient demand from white-collar tenants and transient professionals tied to the digital and services economy. Occupancy in well-located managed apartments and co-living style assets has remained firm, and new supply is more measured than in the past cycle.
Penang: Semiconductor Anchor With Long-Dated Income
Penang remains Malaysia’s semiconductor and advanced manufacturing hub. The state accounts for a significant share of global back-end chip exports and continues to secure fresh investment in assembly, test and automation facilities from multinational firms.
Industrial and logistics assets here offer a slightly different profile from Johor or Klang Valley. Rents have been edging higher rather than spiking, but occupancy is consistently strong and lease covenants are often underpinned by blue-chip tenants. For long-term investors seeking income stability tied to the global electronics cycle, Penang’s technology corridors in Bayan Lepas and Batu Kawan provide an attractive base.
Why Malaysia’s Yield Premium Still Stands Out
Across Johor, Klang Valley and Penang, prime industrial and logistics assets typically trade at yields that are materially higher than those in Singapore and many developed markets. Knight Frank and other advisers continue to place Malaysian prime industrial yields in the high six to seven percent range, compared with nearer four percent in core Singapore logistics and low to mid single digits in major global hubs.
With headline inflation close to 2 percent and the OPR at 2.75 percent, that spread gives investors a comfortable real income buffer. As AI-linked activity scales and more institutional capital targets Malaysia’s tech and logistics corridors, there is clear scope for gradual cap-rate compression, particularly in Johor and Klang Valley.
Our working view is that, barring a severe global downturn, Bank Negara is likely to hold the OPR at 2.75 percent through most of 2026 while monitoring external conditions. In that scenario, Malaysia offers something rare in the current cycle: a combination of macro stability, scalable AI infrastructure growth and a meaningful yield premium.
This is the context in which we evaluate individual assets. The listings that follow focus on income-backed industrial and residential opportunities in Johor and Kuala Lumpur that sit directly in the path of this AI-led real estate re-rating.
6. Featured Listings: Positioning for a Yield-Led Cycle
As global capital becomes more selective and the valuation gap between high-growth markets and stable income markets widens, assets that offer steady cash flow with strategic positioning are beginning to stand out. New Zealand and Malaysia sit on different parts of this spectrum, yet both present opportunities anchored in the same themes that now shape the broader cycle. The first is dependable yield. The second is adjacency to infrastructure that will continue expanding regardless of market sentiment. And the third is a structural shortage of institutional-grade property in corridors linked to logistics, technology, and population movement.
Below are the listings that reflect these conditions and represent the type of assets investors are increasingly targeting in a world where income is the primary language of value.
New Zealand: Stabilised Yield in a Lower-Rate Environment

East Tamaki – High-Spec Logistics Facility
Asking Price: NZD 55 million
Asset Type: Industrial | Modern warehouse and office with large canopy
Land Size: Prime industrial zoned parcel (exact site area undisclosed, typical for precinct)
Built-Up Area: ~100,000 sq ft
Nearby Demand Drivers: SH1 access, Port of Auckland, Auckland Airport, Wiri Inland Port, East Tamaki industrial cluster
Notes:
East Tamaki is one of the most liquid and competitive industrial markets in the country. This asset’s configuration is ideal for high-turnover logistics operations, including hardware staging, cloud equipment storage, and distribution. The precinct benefits from strong occupier demand and very low vacancy rates, which supports rental uplift and long-term asset defensiveness.
Investment Potential:
Estimated Net Yield: ~6.8%
Estimated IRR (5-Year Hold): ~16–18%
Occupancy: ~90-100%
Exit Strategy: Institutional buyer or logistics REIT
Key Advantage: Premium location with superior access to Auckland’s logistics spine

Auckland – Boutique Hotel / Serviced Apartment Block
Asking Price: NZD 30 million
Asset Type: Mixed-Use | 62 apartments + 64 car parks (individually titled)
Land Size: ~3,600 m²
Built-Up Area: ~3,800 m²
Tenure: Freehold
Nearby Demand Drivers: Auckland education hub, transport links, suburban regeneration
Notes:
This is a rare, large-scale titled apartment block currently operated as a boutique hotel. Its dual-use capability (short stay, long stay, student housing, or staged sell-down of individual units) provides an unusual amount of flexibility for an income asset in Auckland. Avondale is undergoing a major regeneration supported by new transport links, higher-density zoning, and sustained tenant demand from students and young professionals.
The property is well positioned to benefit from the easing OCR cycle, with yield stability in the near term and potential capital uplift as financing conditions improve.
Investment Potential:
Estimated Net Yield: ~7.0 to 8.0%
Estimated IRR (5-Year Hold): ~17–19%
Occupancy: ~85-90%
Gross Sell-Down Scenario: ~NZD 40-50 million
Exit Strategy: Staged unit sell-down, PBSA conversion, or institutional sale once stabilised
Key Advantage: Multi-pathway asset offering yield, flexibility and exit optionality in a strengthening suburban corridor
Malaysia: Early-Stage Yield with AI-Adjacent Growth

Port Klang – Logistics and Distribution Facility
Asking Price: MYR 60 million
Asset Type: Industrial | Two-storey logistics and distribution facility
Land Size: ~3.76 acres
Built-Up Area: ~110,000 sq ft
Tenure: Leasehold with approximately 88 years remaining
Nearby Demand Drivers: Port Klang Free Zone, server-import staging, Klang Valley distribution corridor
Notes:
Situated within the country’s busiest maritime gateway, this asset benefits from consistent throughput linked to e-commerce, hardware imports, and regional distribution. Warehouse space in Pulau Indah remains tight, with rising interest from regional occupiers who view the Klang Valley as a cost-effective alternative to Singapore for bulk storage and processing.
Investment Potential:
Estimated Net Yield: ~7.0%
Estimated IRR (5-Year Hold): ~18%
Occupancy: ~85–90%
Exit Strategy: Institutional logistics REIT or cross-border portfolio roll-up
Key Advantage: Transit-oriented freehold property in KL’s densest workforce hub with adaptive reuse potential

Johor – Industrial Warehouse
Asking Price: MYR 100 million
Asset Type: Industrial | Single-storey warehouse with 29 dock levellers and 1,200 Amp power supply
Land Size: ~9.37 acres
Built-Up Area: ~176,400 sq ft
Tenure: Freehold
Nearby Demand Drivers: Senai Airport Logistics Hub, YTL–NVIDIA AI corridor, Johor–Singapore connectivity zone
Notes:
This is one of the larger freehold logistics platforms currently available in Johor’s northern industrial belt. With high-power capacity and an unusually deep land parcel, the property is suited for regional warehousing, hardware staging, or last-mile distribution supporting the emerging AI and cloud ecosystem in Johor. The surrounding area is undergoing a visible uplift in land values as hyperscaler investment accelerates.
Investment Potential:
Net Yield: ~7.0–7.8%
Estimated IRR (5-year hold): ~19-20%
Occupancy: ~90%
Exit Strategy: Institutional logistics fund or partial data-adjacent redevelopment
Key Advantage: Rare large freehold parcel with substantial power supply along Johor’s AI-related growth axis
Want to discuss any of these opportunities further? Reach out to our team directly:
Contact Information :
Petrus Yen - Managing Director
Petrus@fairhavenproperty.co.nz
Daarshan Kunasegaran
Daarshan.Kunasegaran@fairhavenproperty.co.nz
Disclaimer:
The property details, financial figures, and projections provided in this article are based on publicly available information and internal estimates. They are intended for informational purposes only and do not constitute financial advice or an offer to invest. Projections such as IRR and equity multiples are indicative only and subject to change based on market conditions, financing terms, and execution strategy. Interested parties should conduct independent due diligence and consult with a qualified advisor before making any investment decisions. Fairhaven Property Group accepts no liability for decisions made based on the information presented herein.