
From Tech Wars to Tankers: How Power Is Being Tested Through Systems, Supply Chains, and Enforcement in 2026
This report argues that 2026 is shaping up less like a single “crisis moment” and more like a period of controlled stress-testing across the global system. The Venezuela tanker story is a useful entry point because it shows how enforcement, shipping risk, and refinery constraints can transmit uncertainty into real-world pricing faster than headlines suggest. What looks like an oil issue is, in practice, a test of leverage: who can raise costs, restrict flows, and force behaviour change without triggering full-blown disruption.
The same logic runs through the broader US posture described in this edition. Rather than attempting to manage the entire system universally, the United States appears increasingly selective, leaning into asymmetric advantages such as maritime enforcement, dollar-based infrastructure, and strategic geography. This creates a world where outcomes are harder to price cleanly, not because supply disappears, but because friction becomes the dominant condition.
In that environment, capital moves ahead of the data. Investors shorten duration, demand more resilience, and allocate toward assets that can perform across multiple scenarios. Gold’s renewed strength fits this behavioural shift: not necessarily a panic signal, but a reflection of rising demand for insurance when policy alignment and geopolitical trajectories feel less anchored.
The spillovers are already visible in the form of higher uncertainty premia, more fragmented trade and logistics decisions, and shorter investment horizons. This is not a collapse framework. It is an adjustment framework, where differentiation matters and the “middle ground” becomes more valuable than extremes.
Against that backdrop, the report closes by highlighting why New Zealand and Malaysia remain credible destinations for yield-seeking capital in this cycle. New Zealand’s post-tightening setup and improving policy visibility support a yield-led stabilisation case, while Malaysia’s supportive policy stance, contained inflation profile, and currency resilience reinforce its role as a quality yield market with tangible economic demand.
This month’s edition covers:
Tankers, heavy crude, and why Venezuela has become a live test of power, pricing, and enforcement
How the US is reasserting leverage selectively through energy, geography, and financial infrastructure
Why the global system is being stress-tested rather than broken, and how behaviour shifts before data turns
The spillovers investors should watch as friction moves from geopolitics into costs, trade, and capital allocation
Why capital is increasingly searching for balance, not extremes, across the US, Europe, and emerging markets
Why real assets tend to reassert themselves during transitional cycles as yield and visibility regain value
Why New Zealand and Malaysia remain positioned as practical “middle ground” destinations for income-focused capital
1. Tankers, Heavy Crude, and the Real Power Test Behind the Headlines
The story in plain terms
The Venezuela situation is not just another sanctions headline. It is a live stress test of US leverage over energy flows, shipping lanes, and the “grey” infrastructure that has kept sanctioned oil moving. When enforcement tightens, the impact is rarely limited to Venezuela. It shows up in freight rates, refinery margins, regional fuel prices, and the political bargaining power of major buyers.
In early January 2026, reporting indicated US forces seized a fifth tanker linked to Venezuelan oil movements, signalling a more assertive posture toward controlling or disrupting shipments. That escalation matters because it shifts the market from “rules exist” to “rules are being actively enforced,” which is when real repricing begins.
Why Venezuelan crude is uniquely complicated
To understand why this matters, you have to start with the crude itself.
Much of Venezuela’s export blend is heavy and high in sulphur. Heavy crude is thicker, produces more residue, and requires complex refinery hardware to process efficiently. Only a subset of refineries can run it properly at scale, typically facilities with coking units and deep desulphurisation capability.
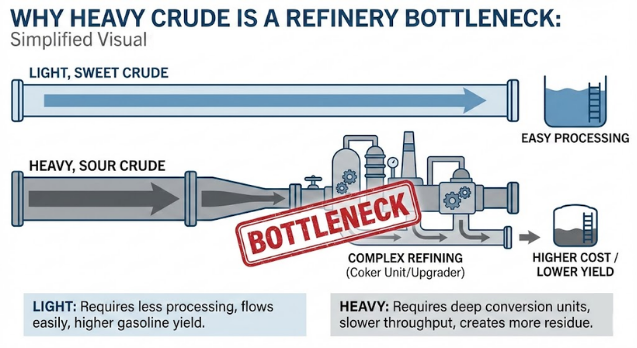
When heavy crude is suddenly harder to move, refineries that depend on it cannot just “swap barrels” without cost. They either pay up for similar heavy grades, cut utilisation, or change their product slate.
That is the hidden leverage point: when the constraint is refinery configuration, the shock travels through the physical system, not just paper markets.
The China angle without oversimplifying it
This is where the “China is the main buyer” framing often becomes too shallow.
Chinese independent refiners have been meaningful buyers of sanctioned barrels (Venezuelan exports via shadow fleet) because they can accept wider logistical complexity in exchange for discounted feedstock. But the bigger point is not simply who buys the crude. It is what happens when a discounted heavy barrel is disrupted in a world where heavy refining capacity is not evenly distributed.
When heavy supply is constrained, you often see:
wider differentials between heavy and light crude grades
pressure on product markets that depend on heavy runs (diesel and certain industrial fuels)
stronger bargaining power for alternative heavy suppliers and blending hubs
higher costs moving through shipping and insurance as enforcement risk rises
Those effects can tighten financial conditions indirectly, because energy price volatility is one of the fastest ways to transmit uncertainty into inflation expectations.
Why this is a US power signal, not just an oil story
If the enforcement narrative continues, the message is broader than Venezuela. It is a signal about how the US is willing to use pressure points that sit between geopolitics and markets: sanctions enforcement, maritime control, and chokepoints in the physical economy.
This is why the Venezuela storyline belongs in a 2026 “power is being tested” framework. It sits alongside other developments where strategy and economics overlap.
This isn't just an oil story, it’s a geographical one. We see the same pattern of strategic positioning in the Arctic. For example, Reuters reported that President Trump is again discussing options for acquiring Greenland, framing it as a national security priority tied to deterrence in the Arctic, even referencing military options. Regardless of whether it progresses, it reinforces the same theme, strategic geography and supply security are back at the centre of policymaking.
What markets do when they cannot price outcomes cleanly
When investors cannot confidently price the endgame, they usually do three things:
demand a higher risk premium in exposed sectors
shorten time horizons and reduce leverage
add “hard” hedges that are not dependent on one political path
What about Gold?
That last point above on hedges is where gold often re-enters the conversation. As we write this, in early January 2026, commentary around gold include banks pushing more aggressive upside scenarios and higher forecast bands, reflecting the market’s appetite for insurance when geopolitical and inflation risks feel unanchored. Gold’s new highs are consistent with rising demand for insurance assets amid geopolitical and policy uncertainty, with major banks also lifting rate-cut expectations in 2026 which supports non-yielding hedges.
2. The United States Reasserts Leverage Through Geography, Energy, and Enforcement
What links Venezuela, Arctic signalling, and renewed trade pressure is not ideology or spectacle. It is method. The United States is no longer trying to manage the global system evenly or universally. Instead, it is reasserting influence where it still holds asymmetric advantage, and doing so selectively.
This is not a return to blanket sanctions or broad trade wars. It is a more targeted form of leverage, focused on pressure points that sit between economics and security and are difficult for markets to neutralise quickly.
Power Through Selectivity, Not Scale
The defining feature of the current US approach is restraint paired with precision. Rather than overwhelming the system, policymakers are leaning into areas where friction can be introduced without triggering immediate retaliation or domestic inflation blowback.
These pressure points share common characteristics. They are operational rather than rhetorical. They sit in the physical economy rather than purely financial markets. And they impose costs through uncertainty rather than outright disruption.
Energy enforcement, maritime control, insurance access, dollar settlement, and strategic geography all fall into this category. Each can be adjusted incrementally, tested in isolation, and escalated or relaxed without committing to an all-or-nothing stance.
This is why recent developments may look disconnected on the surface, but coherent when viewed through a strategic lens.
Energy as Leverage, Not a Price Weapon
The renewed focus on Venezuelan crude illustrates this approach clearly.
The objective is not to drive oil prices higher or lower. US policymakers are acutely aware that energy inflation feeds directly into domestic political risk. Instead, the focus is on controlling flow and increasing friction at the margins.
By tightening enforcement around sanctioned barrels, the US raises uncertainty for shippers, insurers, refiners, and buyers operating in grey channels. Even if volumes continue to move, the cost of doing so rises. Risk premia widen. Insurance becomes harder to secure. Logistics become less predictable.
Over time, this nudges behaviour. Marginal buyers are pushed back toward compliant supply. Operating outside the US-led financial and legal framework becomes more expensive. The dollar-based system is reinforced without requiring dramatic escalation.
This is power exercised through friction rather than force.
Geography Returns as a Strategic Variable
The renewed attention on Greenland fits the same pattern.
On the surface, discussion of acquiring Greenland sounds provocative. In practice, it reflects a deeper shift. Geography is no longer treated as a fixed backdrop to globalisation. It is being reintroduced as an active variable in economic and security planning.
Three considerations underpin this focus. Arctic shipping routes are becoming more viable as conditions change. Greenland sits astride critical air and naval corridors between North America and Europe. And the region holds strategic materials relevant to defence and energy transition supply chains.
Whether any formal acquisition ever occurs is secondary. The signalling itself matters. It tells allies and competitors that the United States is willing to frame economic resilience, supply security, and military positioning as a single strategic problem.
For markets, this reinforces a broader message. Efficiency is no longer the sole organising principle of global capital. Resilience, control, and optionality are now explicit inputs.
Financial Infrastructure as Silent Enforcement
Beyond energy and geography, financial infrastructure remains a central pillar of US leverage.
Dollar settlement, clearing systems, insurance markets, and compliance regimes form an ecosystem that most global trade still relies on. Tightening enforcement within this system does not stop activity outright, but it raises the cost of operating at its edges.
This is particularly effective because it does not require new legislation or dramatic policy shifts. It operates through interpretation, compliance pressure, and selective enforcement. For counterparties, the risk is not just penalty, but exclusion.
As a result, capital allocation decisions increasingly factor in legal and settlement risk alongside traditional metrics like yield and growth.
How Other Powers Read This Posture
China and Russia do not interpret these moves as isolated actions. They read them as components of a broader architecture.
China responds by accelerating efforts to secure supply chains outside US influence, deepen alternative settlement mechanisms, and reduce exposure to chokepoints it does not control. Russia leans further into parallel trade routes and non-dollar arrangements.
Neither response needs to mirror US actions directly to matter. The adjustment itself introduces inefficiency into the global system.
Meanwhile, neutral and middle economies begin reassessing their exposure to any single power bloc. This is where fragmentation deepens quietly, without a defining rupture.
Why This Matters for Markets
When power is exercised selectively rather than universally, markets struggle to price outcomes.
Energy costs may not spike, but volatility increases. Trade volumes may not collapse, but routing becomes less efficient. Capital does not flee, but it becomes more defensive and income-oriented.
This environment is characterised by higher risk premia, shorter investment horizons, and greater emphasis on assets that can perform without perfect geopolitical alignment.
This is not a crisis framework. It is an adjustment framework.
Understanding this distinction is critical, because it explains why capital behaviour changes before economic data does. And it sets the stage for the next question investors must confront:
If the system is being stressed rather than broken, how does capital respond before the stress becomes visible in growth and inflation numbers?
3. A World Being Stress-Tested, Not Broken
Why This Matters for Markets, Trade, and Capital Flows
How Markets, Capital, and Behaviour Adjust Before the Data Turns
The most important feature of the current global environment is that it does not resemble a classic crisis cycle. There is no single shock, no sudden collapse in demand, and no coordinated policy failure. Instead, the system is being deliberately stressed in specific areas, and markets are being forced to adapt without the clarity of a clean resolution.
This distinction matters. Markets are used to pricing either stability or rupture. What they struggle with is prolonged ambiguity.
Controlled Friction Becomes the Dominant Condition
Across energy, trade, and geopolitics, the common thread is not disruption but friction.
Oil continues to flow, but enforcement risk adds cost. Trade routes remain open, but logistics become less efficient. Capital still moves, but with greater selectivity and shorter horizons. None of these changes are dramatic on their own. Together, they alter behaviour.
This is why volatility can rise even when headline indicators remain stable. Prices are not responding to shortage. They are responding to uncertainty.
In energy markets, for example, supply has not collapsed. Yet price sensitivity remains elevated because traders and refiners must now account for enforcement risk, insurance constraints, and routing uncertainty. That risk premium is embedded quietly into contracts, freight rates, and margins, long before it shows up in consumer prices.
Capital Moves Ahead of Economic Data
One of the most consistent patterns in global cycles is that capital responds before economies do.
Before GDP slows, investors shorten duration. Before inflation re-accelerates, hedging activity increases. Before trade volumes visibly shift, investment flows begin reallocating toward resilience rather than efficiency.
That process is already underway.
Large pools of capital are becoming more cautious about long-horizon commitments that rely on stable geopolitics or uninterrupted global integration. Projects with extended payback periods face higher hurdle rates. Exposure to concentrated supply chains is being reassessed.
At the same time, capital is not retreating wholesale. It is repositioning toward assets and jurisdictions where outcomes remain predictable even if the global backdrop does not.
From Growth Optimisation to Risk Compartmentalisation
Another defining feature of this phase is how investors are reframing risk.
Instead of optimising for maximum growth, portfolios are increasingly structured around compartmentalisation. Exposure is spread across regions, asset types, and income streams in a way that reduces dependence on any single political or economic outcome.
This shows up in several ways:
Investors favour assets that generate cash flow early in the holding period
Leverage is used more conservatively, with less reliance on terminal value
Geographic diversification prioritises stability over marginal yield uplift
The emphasis shifts from “what delivers the highest return” to “what continues to perform under multiple scenarios”.
This behavioural change is subtle, but it is powerful. It alters demand patterns across asset classes long before headline data confirms a slowdown or reacceleration.
Gold as a Behavioural Signal, Not a Panic Signal
The renewed strength in gold prices fits squarely within this framework.
Gold reaching new highs does not imply that markets expect imminent collapse. Historically, gold rallies during periods when investors are uncertain about policy alignment, currency stability, or geopolitical direction, even if growth continues.
In this cycle, gold is functioning less as a crisis hedge and more as balance-sheet insurance. Central banks and large allocators are increasing exposure not because they expect catastrophe, but because they want resilience if multiple risks materialise at once.
That behaviour aligns closely with what is happening across real assets and infrastructure investment. Capital is not fleeing productive assets. It is pairing them with anchors that reduce dependency on any single narrative.
Markets Price Adjustment, Not Resolution
The key takeaway from this phase is that markets are not waiting for clarity. They are pricing adjustments.
Risk premia rise even without a shock. Volatility persists even without collapse. Asset performance becomes more differentiated rather than uniformly positive or negative.
This is why traditional indicators can feel misleading. Growth may still exist. Inflation may still be easing. Yet asset allocation decisions are becoming more defensive, more income-oriented, and more geographically selective.
Understanding this helps explain why certain asset classes and regions begin to attract capital quietly, without dramatic headlines or exuberant sentiment. The repricing happens through behaviour first, data later.
4. The Economic Spillovers Begin to Show
Strategic pressure rarely stays confined to the original point of tension. Once energy routes, trade logistics, and political signalling start to shift, the effects propagate outward through costs, confidence, and capital allocation. This is the phase global markets are entering now.
What began as isolated geopolitical manoeuvring is starting to translate into measurable economic consequences.
Energy as the First Transmission Channel
Energy is almost always the first place spillovers appear because it sits at the base of every supply chain. Even without outright shortages, uncertainty around enforcement, shipping access, and refinery compatibility changes behaviour.
Refiners hedge more aggressively. Traders widen margins. Transport operators price in buffers. None of this requires prices to spike dramatically to matter. The cumulative effect is a slow upward pressure on costs and a reduction in efficiency.
This is why energy-driven uncertainty often shows up in core inflation measures months later, even when headline inflation appears stable. It is not the price of oil alone, but the friction it introduces into logistics and production.
Trade Friction Without Trade Collapse
Global trade is not contracting sharply, but it is becoming more fragmented.
Companies are diversifying suppliers, adding regional redundancy, and accepting higher operating costs in exchange for reliability. This behaviour does not reduce trade volumes overnight, but it does reduce the speed and predictability of trade flows.
For economies built on just-in-time efficiency, this is a meaningful shift. Growth becomes less explosive but more uneven. Some regions gain incremental activity as alternatives are built out. Others lose marginal relevance as concentration risk is reduced.
This is particularly visible in manufacturing, logistics, and industrial real estate, where demand increasingly reflects strategic placement rather than pure cost optimisation.
Currency Markets Reflect the Adjustment
Currencies often act as early warning systems, and recent moves reinforce the idea that capital is repositioning rather than panicking.
The US dollar remains firm, but no longer unchallenged. Safe-haven demand is being shared with gold and select regional currencies rather than flowing exclusively into dollar assets. This tells us that investors are hedging geopolitical risk without fully exiting global exposure.
At the same time, currencies tied to credible policy frameworks and improving fundamentals are being treated more favourably than in previous cycles. This differentiation matters, because it shapes where capital is willing to commit for longer durations.
Investment Timelines Are Being Shortened
Another subtle but important effect is the compression of acceptable investment horizons.
Projects that once justified ten- to fifteen-year assumptions are now being evaluated on seven- to ten-year frameworks. Investors want earlier visibility on cash flow and clearer exit optionality. This does not eliminate long-term investment, but it raises the bar for what qualifies.
Real assets that can demonstrate stable income early in the holding period become disproportionately attractive. Assets that rely heavily on terminal value or distant growth assumptions face more scepticism.
Why This Phase Is Misread by Markets
Markets often struggle with periods like this because they do not fit clean narratives.
There is no crisis to price in aggressively. There is no boom to chase enthusiastically. Instead, there is adjustment, repricing, and differentiation. Volatility rises not because outcomes are catastrophic, but because they are less synchronised.
This is where many investors get caught flat-footed. They wait for clarity that never arrives in a single announcement, while capital quietly reallocates underneath them.
Understanding this spillover phase is essential because it explains why certain asset classes and regions begin to attract attention before headline data confirms the shift.
The next section builds on this logic by looking at how the broader global economy is responding to this redistribution of risk and opportunity, and where capital is increasingly choosing to sit when neither extremes feel comfortable.
5. The Search for Balance and Not Extremes
As geopolitical pressure builds and energy, trade, and currency signals begin to shift, the global economy enters a less familiar phase. This is no longer a story of synchronized growth or synchronized stress. It is a story of divergence.
Different regions are responding to the same global forces in very different ways, and capital is reacting accordingly.
The United States: Strength With Increasing Fragility
The United States remains the anchor of global capital markets, but its leadership is becoming narrower. Financial conditions have eased relative to 2023, yet asset prices remain elevated and increasingly concentrated.
A small group of technology and defence-adjacent sectors continue to attract the majority of flows, while large parts of the real economy show slower momentum. This imbalance creates a perception of resilience that is heavily dependent on continued confidence rather than broad-based growth.
At the same time, geopolitical ambition brings its own costs. Energy security manoeuvres, strategic posturing, and external pressure campaigns all add layers of uncertainty. While none of these are immediately destabilising, they reduce visibility for long-term investment and increase the premium investors place on optionality and liquidity.
The US still attracts capital, but it is no longer absorbing it unconditionally. Investors are more selective, more tactical, and less willing to accept long-duration risk without compensation.
Europe: Stability Without Momentum
Europe occupies a different position. Its institutions provide a sense of order, but growth remains constrained.
Energy diversification has improved since earlier shocks, yet costs remain structurally higher than pre-crisis norms. Demographics continue to weigh on productivity, and fiscal flexibility is limited by political fragmentation and legacy debt.
For capital, Europe functions as a defensive allocation. It preserves value rather than compounds it aggressively. In periods of global uncertainty, this has appeal, but it does not satisfy investors seeking income growth or real asset repricing.
As a result, Europe is part of the solution for portfolio balance, but rarely the destination for incremental return-seeking capital during transitional cycles like this one.
Emerging Markets: Opportunity With Friction
Emerging markets remain rich in opportunity, but also in complexity.
Manufacturing relocation, population growth, and infrastructure investment continue to support long-term potential. However, currency volatility, regulatory unpredictability, and geopolitical exposure complicate deployment decisions.
In uncertain global environments, capital becomes more selective within emerging markets. It favours assets with visible cash flow, shorter payback periods, and exposure to international rather than purely domestic demand.
This is why emerging markets do not experience uniform inflows. Instead, specific corridors, sectors, and asset types benefit while others remain sidelined.
The Result: Capital Finds a Middle Ground
When the US feels crowded, Europe feels slow, and emerging markets feel volatile, capital does not stop moving. It recalibrates.
What investors increasingly seek is a middle ground. Markets that are not trying to maximise growth at all costs, but also not sacrificing return for safety alone.
This middle ground has clear characteristics:
Credible policy frameworks and institutional stability
Moderate but durable growth drivers
Positive real yields that compensate for risk
Exposure to real economic activity rather than financial narratives
Capital flowing into these environments is not speculative. It is strategic. It is positioning for a world where uncertainty persists, but opportunity still exists.
This is the macro backdrop that explains why real assets begin to regain prominence at this stage of the cycle. Not as a hedge against collapse, but as a foundation for navigating a fragmented global economy.
6. Why Real Assets Reassert Themselves in Transitional Cycles
When global conditions shift from expansion to adjustment, capital behaviour changes in predictable ways. Financial markets react quickly to narratives, policy signals, and sentiment. Real assets respond more slowly, but more durably. That distinction becomes critical in periods like the one now unfolding.
This is not a new phenomenon. It is a recurring feature of late-cycle and early-easing environments.
Falling Rates Change the Rules of Allocation
The most immediate impact of a global easing cycle is not speculative enthusiasm. It is a repricing of certainty.
When policy rates fall, the opportunity cost of holding income-producing assets declines. Cash and short-duration instruments become less compelling, while assets that can deliver stable yield regain relevance. This effect is magnified when inflation is moderating rather than accelerating.
Historically, major easing phases have coincided with a steady reallocation toward real assets. After the early-2000s rate cuts, property and infrastructure outperformed broad equities as income streams were valued more highly than uncertain growth. A similar pattern emerged after the Global Financial Crisis, when prolonged low rates supported years of gradual repricing in income-backed assets.
What matters most is not the first cut, but the shift in regime. Once markets accept that policy is no longer restrictive, the discount rate applied to long-dated cash flows changes. Real assets benefit directly from that recalibration.
Income Certainty Becomes a Scarce Asset
Periods of geopolitical tension and currency volatility tend to elevate the value of predictability.
When exchange rates fluctuate and financial markets become more sensitive to external shocks, investors place greater emphasis on assets that generate visible, contractual income. This is particularly true for cross-border capital, where yield can help offset currency risk.
Real assets occupy a unique position here. Industrial leases, residential rents, and infrastructure-linked cash flows are not immune to cycles, but they are anchored in physical use and contractual obligation rather than market sentiment. That makes them more resilient when volatility increases.
This is why pension funds, sovereign investors, and insurers consistently raise real asset allocations during transitional periods. The objective is not aggressive growth, but income durability.
Structural Change Appears First in Physical Markets
Another reason real assets reassert themselves during adjustment phases is timing.
Economic restructuring shows up in physical demand before it appears in financial statements. Trade rerouting increases warehouse utilisation before it lifts listed logistics earnings. Population movement tightens rental markets before it shows up in national growth forecasts. Infrastructure investment consumes land and power capacity years before it fully feeds into GDP.
This lag matters. By the time financial markets price in structural change, real assets linked to that change are often already generating higher income. The repricing occurs quietly through stronger occupancy, rental growth, and covenant quality rather than headline-driven re-ratings.
That pattern is visible today across logistics, industrial, and managed residential sectors tied to supply chains, energy, and workforce mobility.
Evidence From Past Cycles
The outperformance of real assets during transitional phases is well documented.
During the mid-2000s trade expansion, logistics and industrial property benefited from global supply-chain growth before equities fully recognised the shift. Following the Global Financial Crisis, income-producing property delivered strong risk-adjusted returns as rates remained low and volatility stayed elevated.
More recently, during the pandemic period, assets with physical utility and essential demand recovered faster than many growth-oriented financial assets. Warehousing, residential rental stock, and infrastructure-linked property demonstrated resilience precisely because demand was rooted in real-world use.
These episodes differ in context, but the underlying mechanics are consistent.
Why This Cycle Fits the Same Pattern
The current environment combines several familiar drivers.
Global rates are easing. Currency volatility is rising. Trade and energy flows are being reconfigured. Capital is becoming more selective and less tolerant of narrative risk.
At the same time, financial markets remain concentrated and sensitive to shifts in confidence. That increases the appeal of assets whose return drivers are simpler and more transparent.
Real assets benefit not because they are immune to cycles, but because their fundamentals are measurable. Income is paid today. Demand is observable. Supply constraints are visible.
This is why, as global capital searches for balance rather than extremes, real assets often become the default winner. Not as a speculative play, but as a stabilising allocation that absorbs structural change while continuing to generate cash flow.
The final step is identifying where this dynamic is most clearly expressed today. Not all markets offer the same combination of yield, stability, and structural demand.
7. Why Capital is Settling Between Malaysia and New Zealand
As global capital recalibrates away from extremes, it does not move indiscriminately. It looks for jurisdictions where outcomes remain measurable even when the global backdrop is not. In the current cycle, New Zealand and Malaysia occupy that middle ground from very different starting points, yet arrive at the same destination: defensible yield, improving policy visibility, and tangible economic demand.
They are not competing on scale or speed. They are competing on clarity.
New Zealand: Yield Stability in a Post-Tightening Environment
New Zealand’s appeal in this phase of the cycle is primarily about timing.
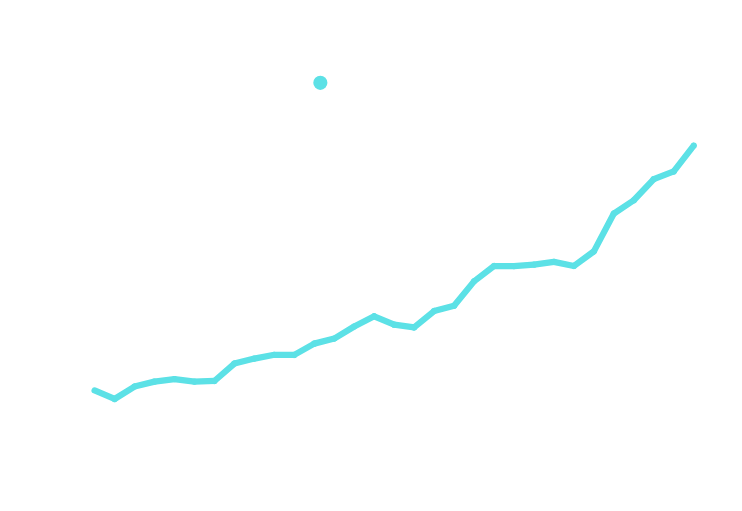
The inflation shock has already passed through the system. Policy tightened early and aggressively, and easing has already begun. With the Official Cash Rate now at 2.25 percent and inflation moderating into the low-3 percent range, real rates are no longer restrictive. This matters because real assets typically reprice when the cost of money falls faster than income does.
This chart shows the regime shift clearly. Monetary policy is no longer fighting inflation. It is creating space for income assets to stabilise and re-rate. Importantly, this is happening without the need for aggressive growth assumptions.
New Zealand property is not entering a speculative phase. It is entering a stabilisation phase where income matters more than near-term price movement. As borrowing costs fall while rents remain anchored, the spread between funding and income begins to improve.
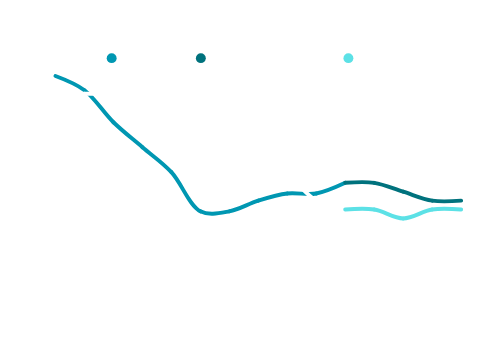
On the supply side, the story is even clearer.
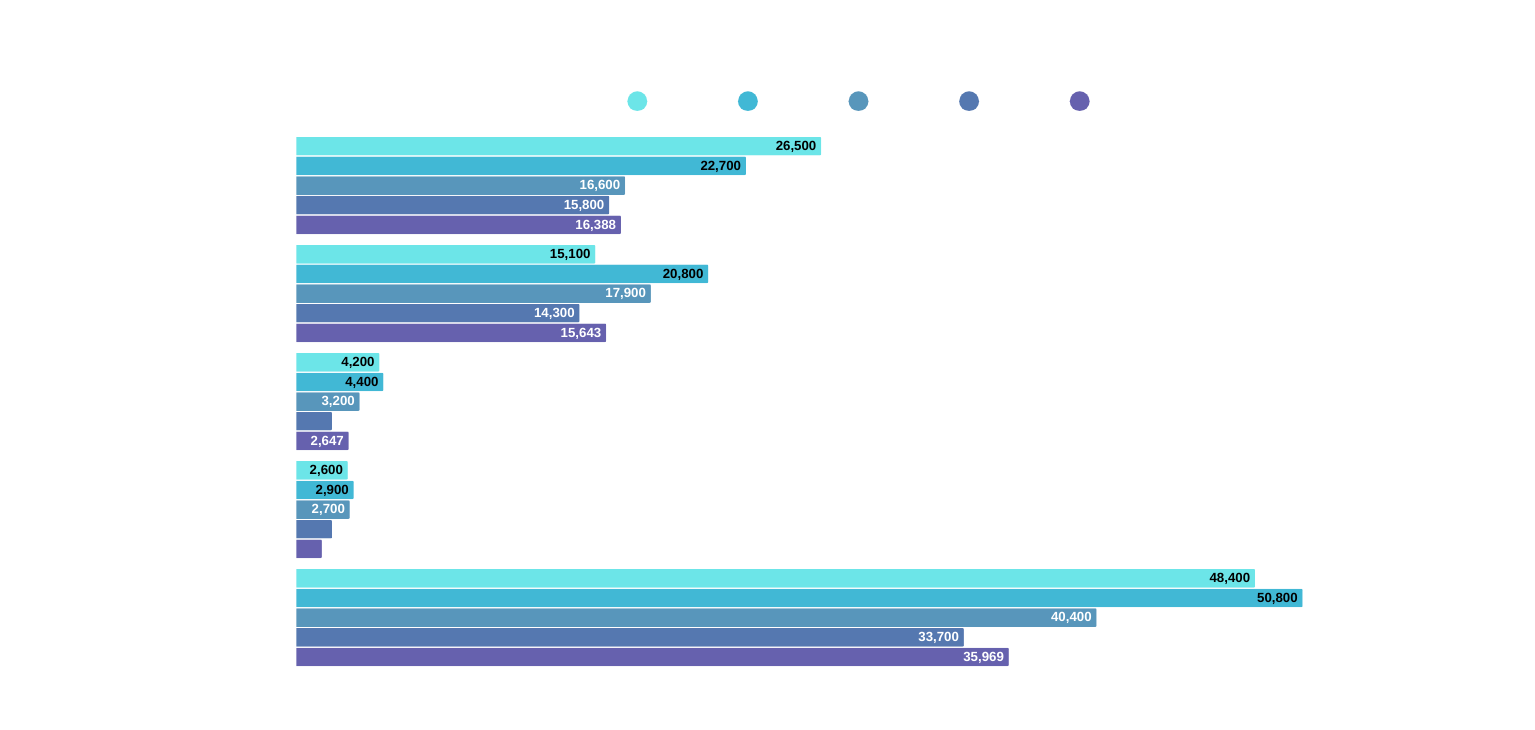
Residential construction has stepped down materially from the 2021–2022 peak across stand-alone homes, apartments, and retirement units. Development activity has been constrained by build costs, credit availability, and margin pressure. This reduction in future supply tends to firm occupancy and rents before it lifts headline prices.
Historically, New Zealand real estate cycles bottom on supply, not demand. This chart suggests that process is already underway, with some upside in supply being observed as of end of 2025 comparing to previous year.
Currency dynamics add another layer of asymmetry.
The New Zealand dollar remains below its long-term average, lowering the effective entry price for offshore capital. For investors funding in stronger currencies, this creates a profile where income is earned locally while any currency normalisation becomes upside rather than a prerequisite.
Taken together, New Zealand offers a transparent, rule-of-law market where income stability improves as policy pressure eases, without relying on aggressive growth narratives.
Malaysia: Yield Premium with Structural Momentum
Malaysia plays a different role in global portfolios, but one that is increasingly relevant in this environment.
The key shift is that monetary policy is no longer just stable. It is now mildly supportive. Bank Negara’s decision to cut the Overnight Policy Rate to 2.75 percent in 2025 marked a transition from inflation defence to growth support, and policy has since remained steady.
This stability matters. It reduces rate uncertainty while keeping borrowing costs manageable for income-producing assets.
Inflation dynamics reinforce the picture.
Headline inflation has eased into the low-to-mid 1 percent range, creating a positive real yield environment without forcing restrictive conditions. For real assets, this is close to ideal: funding costs are controlled, income yields remain attractive, and policy credibility is intact.
Malaysia’s yield premium remains one of its strongest differentiators. Prime industrial and logistics assets continue to trade at yields materially above those in developed markets, including Singapore. As global rates fall, that spread becomes increasingly valuable.
Currency performance strengthens the case further.
The ringgit has emerged as one of the stronger-performing currencies in the region, supported by improving fundamentals, firmer capital flows, and growing confidence in Malaysia’s reform trajectory. With USD/MYR continuing to trend lower, currency risk is no longer a background concern but an active tailwind for offshore investors. This shifts Malaysia’s positioning away from the traditional high-risk emerging market label and toward a quality carry destination with improving FX dynamics.
Structurally, Malaysia continues to absorb real economic activity rather than speculative demand. Manufacturing, trade, and logistics form the base layer of property demand, providing consistency through cycles. AI infrastructure, data centres, and semiconductor spillover act as accelerants rather than single-point dependencies. That distinction matters, because it anchors real estate demand in broad economic function and operating cash flow, not in a narrow thematic narrative.
Two Markets, One Capital Logic
New Zealand and Malaysia attract capital for different reasons, but along the same axis.
New Zealand offers income stability, policy clarity, and defensible assets as rates ease.
Malaysia offers yield premium, structural growth corridors, and improving currency confidence.
Both sit in the middle ground global capital is increasingly favouring. They are not the cheapest. They are not the fastest growing. But they offer something increasingly scarce: visibility.
This is why capital tends to arrive quietly in these markets. Not chasing headlines, but building exposure where income, policy, and structure align.
8. Featured Listings: The Strategic Middle Ground
New Zealand: The Geopolitical Safe Haven, Locking in Yield Far from the Friction

Manukau City — Institutional-Scale Industrial (Logistics/Warehouse)
Type: Large-format industrial / distribution
Indicative RV: ~NZD 42.0m
Indicative Net Yield / Cap Rate: ~6.0%–7.0%
Occupancy: ~90%
Site / Building: ~3.92 ha land | ~14,208 m² built
Notes:
A defensive, supply-constrained logistics node in South Auckland, benefiting from long-run demand drivers (population corridor + motorway connectivity). In a “controlled friction” world, industrial income with real-world utility tends to hold up better than narrative-driven risk.
Investment Potential:
Core-plus income with upside via leasing lift and tenancy optimisation
Rate-cut sensitivity: potential for modest yield compression when financing costs ease
Exit options: long-term hold for income, or institutional/REIT-style buyer appetite due to scale

East Tamaki – High-Spec Logistics Facility
Type: Modern logistics / distribution facility
Indicative Pricing: ~NZD 55.0m
Indicative Net Yield / Cap Rate: ~6.5%–7.0%
Occupancy: ~90%–100% (range depending on final lease profile)
Building: ~100,000 sq ft (approx.)
Notes:
East Tamaki is one of NZ’s most liquid industrial precincts with structurally tight vacancy. In environments where trade routes and supply chains get re-optimised, premium logistics locations often benefit first through stronger tenant demand and pricing power.
Investment Potential:
“Quality logistics” exposure with strong re-leasing defensiveness
Rental uplift potential in low-vacancy micro-markets
Exit options: institutional buyer or logistics-focused REIT mandate

Auckland Fringe — Dual-Tower Office Complex (Core-Plus + Optionality)
Type: CBD-fringe office / mixed-use optionality
Indicative
Asking: ~NZD 40.0m
Indicative Cap Rate: ~7.0% (approx.)
Occupancy: ~90%
Site / Building: ~4,000 m² land | ~12,500 m² built (dual towers)
Notes:
This is less a “pure office” bet and more an optionality bet: location, transport connectivity, and nearby education/amenity nodes can support repositioning pathways over time. In an adjustment cycle, assets with multiple feasible end-states can be more resilient than single-use assets.
Investment Potential:
Core-plus carry while executing leasing/repositioning
Value creation path: staged re-leasing + targeted upgrades (not full redevelopment)
Optionality lens: explore conversion feasibility (where permitted) or hybrid tenant mix to reduce single-sector risk
Malaysia: The Energy Pivot, Leveraging Supply Chain Shifts and Regional Stability

Port Klang – Logistics and Distribution Facility
Indicative Pricing: ~MYR 55.0m
Type: Industrial | Two-storey office + single-storey detached factory
Tenure: Leasehold (~88 years remaining)
Land / Building: ~163,786 sq ft land | ~110,000 sq ft built
Power Supply: ~1,000 Amp
Notes:
Positioned within Malaysia’s highest-throughput port ecosystem, this facility benefits from sustained demand tied to import-export activity, e-commerce fulfilment, and technology hardware staging. Its physical configuration, ceiling clearance, yard layout, and loading infrastructure, aligns well with modern logistics operators servicing regional supply chains, including AI-related component movement through Port Klang.
The asset sits within an established logistics corridor rather than a speculative growth zone, which supports income visibility through cycles.
Investment Potential:
Defensive logistics exposure linked to Malaysia’s core port infrastructure
Suitable for long-lease tenants with regional distribution requirements
Attractive roll-up candidate for logistics-focused REITs or institutional portfolios
Beneficiary of falling rate environment through yield re-rating rather than aggressive rental assumptions

Johor – Large-Scale Industrial Warehouse
Indicative Pricing: ~MYR 100.0m
Type: Industrial | Single-storey warehouse with 29 dock levellers
Tenure: Freehold
Land / Building: ~9.37 acres | ~176,400 sq ft built
Power Supply: ~1,200 Amp
Nearby Demand Drivers: Senai Airport Logistics Hub, YTL–NVIDIA AI corridor, Johor–Singapore connectivity zone
Notes:
This is one of the larger freehold logistics assets currently available in Johor’s northern industrial belt. Its scale, dock configuration, and high-power capacity make it well suited for regional warehousing, hardware staging, and distribution functions supporting Johor’s rapidly evolving technology and data ecosystem.
The surrounding corridor has experienced visible land value appreciation, driven by increasing hyperscaler, semiconductor, and cross-border logistics activity linked to Johor–Singapore connectivity.
Investment Potential:
Rare freehold industrial platform with long-term redevelopment optionality
Strong alignment with Johor’s emerging AI, cloud, and data-adjacent infrastructure corridor
Potential to transition from pure logistics into higher-value, power-intensive use over time
Clear institutional exit pathways as Johor matures into a regional logistics and digital hub
Want to discuss any of these opportunities further? Reach out to our team directly:
Contact Information :
Petrus Yen - Managing Director
Petrus@fairhavenproperty.co.nz
Daarshan Kunasegaran
Daarshan.Kunasegaran@fairhavenproperty.co.nz
Disclaimer:
The property details, financial figures, and projections provided in this article are based on publicly available information and internal estimates. They are intended for informational purposes only and do not constitute financial advice or an offer to invest. Projections such as IRR and equity multiples are indicative only and subject to change based on market conditions, financing terms, and execution strategy. Interested parties should conduct independent due diligence and consult with a qualified advisor before making any investment decisions. Fairhaven Property Group accepts no liability for decisions made based on the information presented herein.