
Gold, Bitcoin, Property & The Debt-Based Paradox: What Survives When Leverage Gets Tested
Markets are not reacting to a single crisis. They are adjusting to structural tension.
In early 2026, gold is breaking to fresh highs. Bitcoin has swung violently from record levels. Bond markets remain unstable. Equity leadership is narrow. Central banks continue diversifying reserves. Japan’s bond market volatility is spilling into global yields. AI adoption is accelerating while labour markets soften.
Individually, none of these developments are catastrophic. Collectively, they point to something more important:
The global debt-based system is being stress-tested by technology, geopolitics, and monetary transition, all at the same time.
This month’s report argues that the defining feature of 2026 is not collapse, but leverage sensitivity. When debt levels are high and future income assumptions become less certain, capital begins to reposition before economic data visibly deteriorates.
In this environment, volatility in gold and Bitcoin is not noise, it is a signal. It reflects investors searching for stability in a world where forward assumptions feel less anchored.
The question for wholesale investors is no longer which asset will outperform in a single scenario. It is which combination of assets can perform across multiple outcomes.
This month’s edition covers:
The Debt-Based System and the Leverage Paradox in 2026
Why Gold Is Surging and What It Actually Signals
Bitcoin, Synthetic Exposure, and Liquidity Stress
Japan, Bond Markets, and the End of Cheap Global Money
From Volatility to Allocation: How Capital Repositions Before Data Turns
A Diversification Framework for Transitional Cycles
New Zealand and Malaysia in all of this
1. The Paradox at the Core of the System
A Debt System That Assumes More Tomorrow
For most of the past eighty years, the global economy has operated on a relatively simple assumption. We borrow from the future in order to grow in the present. Governments issue debt. Corporations refinance and expand. Investors use leverage to enhance returns. Households borrow against rising incomes and appreciating assets.
The system works as long as three conditions broadly hold. Interest rates remain manageable. The workforce expands or at least remains productive. Future income is expected to be larger than today’s obligations.
In that world, leverage is not reckless. It is rational. If the cost of money is lower than the return on assets, borrowing becomes a feature of the system, not a flaw. Asset prices rise because future cash flows are discounted at low rates. Governments can roll over liabilities. Corporations can refinance. Markets reward forward growth assumptions.
This is the architecture that underpins modern valuations.
AI and the Growth Assumption
The tension emerges when that forward growth assumption becomes less certain.
Recent commentary from leading AI firms suggests that automation could materially reduce white collar labour demand over the next five years. Even if those projections prove exaggerated, the direction of travel is clear. Productivity may rise, but the distribution of income may narrow. Fewer workers may be required to generate the same output.
That introduces a structural question. A debt-based system depends not just on productivity, but on income participation. It requires enough people earning, borrowing, consuming, and paying taxes to sustain the expansion of credit.
If automation reduces labour participation faster than new industries can absorb displaced workers, then the relationship between debt growth and income growth begins to loosen. The system does not collapse immediately. But its internal logic becomes less comfortable.
Markets are forward looking. When uncertainty enters the future income equation, leverage feels less safe.
Leverage and the Fragility of Confidence
Leverage magnifies returns when conditions are stable. It magnifies volatility when confidence weakens.
In periods of uncertainty, investors reassess risk rapidly. Borrowed positions are reduced. Margin calls force asset sales. Liquidity becomes more valuable than optionality. This is not a moral judgment about debt. It is simply the mechanical reality of how leveraged systems behave under stress.
What is different about the current moment is that the stress is not coming from a single shock. It is coming from a series of overlapping questions. How durable is global growth. How stable are geopolitical alliances. How predictable are funding markets. How transformative will AI truly be.
When those questions compound, markets react before data confirms anything. Volatility increases. The most liquid assets move first. Bitcoin trades continuously and absorbs sentiment almost instantly. Gold rallies when trust in monetary frameworks feels thinner. Equity markets rotate toward defensiveness.
These are not signs of immediate collapse. They are signals that capital is repricing uncertainty.
The Monetary Backdrop Is No Longer Simple
Complicating the picture further is the shift in global funding conditions.
For decades, ultra low rates in major economies encouraged capital to flow freely. Borrowing was cheap. Risk was rewarded. Carry trades flourished. Yield curve control in Japan, in particular, anchored global liquidity by keeping bond yields suppressed and funding costs stable.
That stability is no longer guaranteed. When bond markets in large economies experience outsized moves, the ripple effects extend well beyond domestic borders. Higher yields raise refinancing costs. Currency pressures intensify. Global capital must adjust.
A system built on the assumption that debt can always be rolled over cheaply becomes more sensitive when rates are volatile or unpredictable.
The paradox becomes clearer. Markets have priced the future on the expectation of continued expansion. Yet technological disruption, geopolitical realignment, and funding stress all challenge the smooth continuation of that expansion.
Both narratives cannot be fully true at the same time.
Stress Testing, Not Collapse
It is important to remain precise here. The global system is not breaking in an obvious or dramatic fashion. It is being stress tested.
Debt still functions. Labour markets still exist. Corporations are still profitable. But the margin for error is thinner. The assumptions that underpinned the previous decade are no longer universally accepted.
In this environment, capital begins to behave differently. Investors seek visibility over speculation. They favour cash flow over distant optionality. They become less willing to rely on terminal value assumptions that depend on flawless global coordination.
This behavioural shift is the early signal. The data often follows later.
2. Gold at Highs and What the Market Is Really Signalling
A Break to New Highs in a Non Crisis Environment
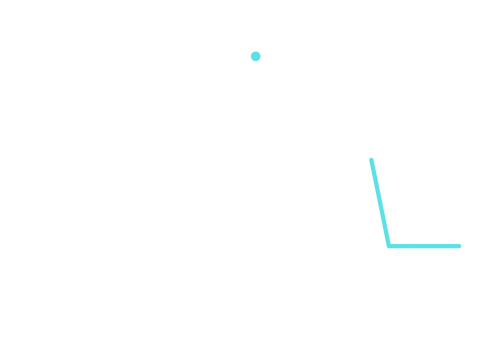
Gold has moved to fresh highs in early 2026. That fact alone is not unusual in a world accustomed to monetary expansion. What is notable is the context.
We are not in a banking collapse. We are not in a liquidity freeze. Equity markets, while volatile, have not experienced systemic breakdown. Yet gold continues to push higher, with monthly averages trending firmly upward into February 2026.
That behaviour deserves interpretation.
Historically, gold surges during two broad regimes. The first is overt crisis, where capital seeks immediate safety. The second is strategic uncertainty, where investors are less concerned about imminent collapse and more concerned about the durability of monetary and geopolitical frameworks.
The current rally fits the second category more closely.
Rates, Real Yields, and the Repricing of Insurance
Gold does not produce income. Its appeal strengthens when the opportunity cost of holding it declines.
As rate expectations shift and markets begin pricing easing cycles across several developed economies, real yield trajectories become less punitive for non yielding assets. Even modest declines in forward real rates can materially change gold’s relative attractiveness.
At the same time, bond markets are no longer perceived as risk free in the psychological sense. Large moves in sovereign yields, particularly in Japan and parts of Europe, have reminded investors that even government debt can experience volatility.
When the asset traditionally viewed as the safest store of value becomes price sensitive, diversification behaviour expands beyond bonds alone.
Gold benefits from that shift.
Central Bank Demand and Reserve Diversification
Another structural force underpinning the move is central bank behaviour.
Over the past two years, central banks have increased gold allocations at one of the fastest paces in decades. This is not retail speculation. It is institutional reserve diversification.
The rationale is straightforward. In a world where sanctions, settlement systems, and currency networks are increasingly weaponised, holding a neutral, non sovereign reserve asset carries strategic appeal.
Gold does not rely on a counterparty. It does not depend on dollar clearing access. It is not tied to the credit profile of any single government.
This does not mean the dollar is being replaced tomorrow. It does mean reserve managers are adjusting marginal allocations in response to geopolitical uncertainty.
That steady, structural demand is different from panic buying. It is portfolio rebalancing at the sovereign level.
Volatility Beneath the Surface
While gold has trended higher, it has not done so in a straight line. Intraday swings have widened. Correlations with other assets have shifted. There have been sessions where gold and equities fall together, followed by days where they decouple sharply.
This is typical in deleveraging phases.
When leverage unwinds, even traditional safe havens can be sold temporarily to meet margin requirements. The short term price action can therefore look disorderly even if the longer term thesis remains intact.
It is important to separate mechanical selling from structural demand.
The monthly average trend illustrates the broader trajectory. The path is volatile, but the direction reflects sustained allocation rather than episodic panic.
Gold as a Behavioural Indicator
The more important takeaway is not the price level itself. It is what the rally implies about behaviour.
Markets appear less comfortable relying exclusively on financial claims. In a world where debt levels are high, geopolitical trust is thinner, and monetary regimes are being questioned, investors are adding balance sheet insurance.
Gold’s strength suggests that capital is hedging against systemic uncertainty rather than forecasting immediate breakdown.
It also highlights a broader theme. When the foundations of a debt based system are being questioned, even subtly, tangible stores of value regain psychological importance.
This does not automatically mean that all financial assets are mispriced. It does signal that confidence is no longer unconditional.
3. Bitcoin, Synthetic Liquidity, and the Illusion of Scarcity
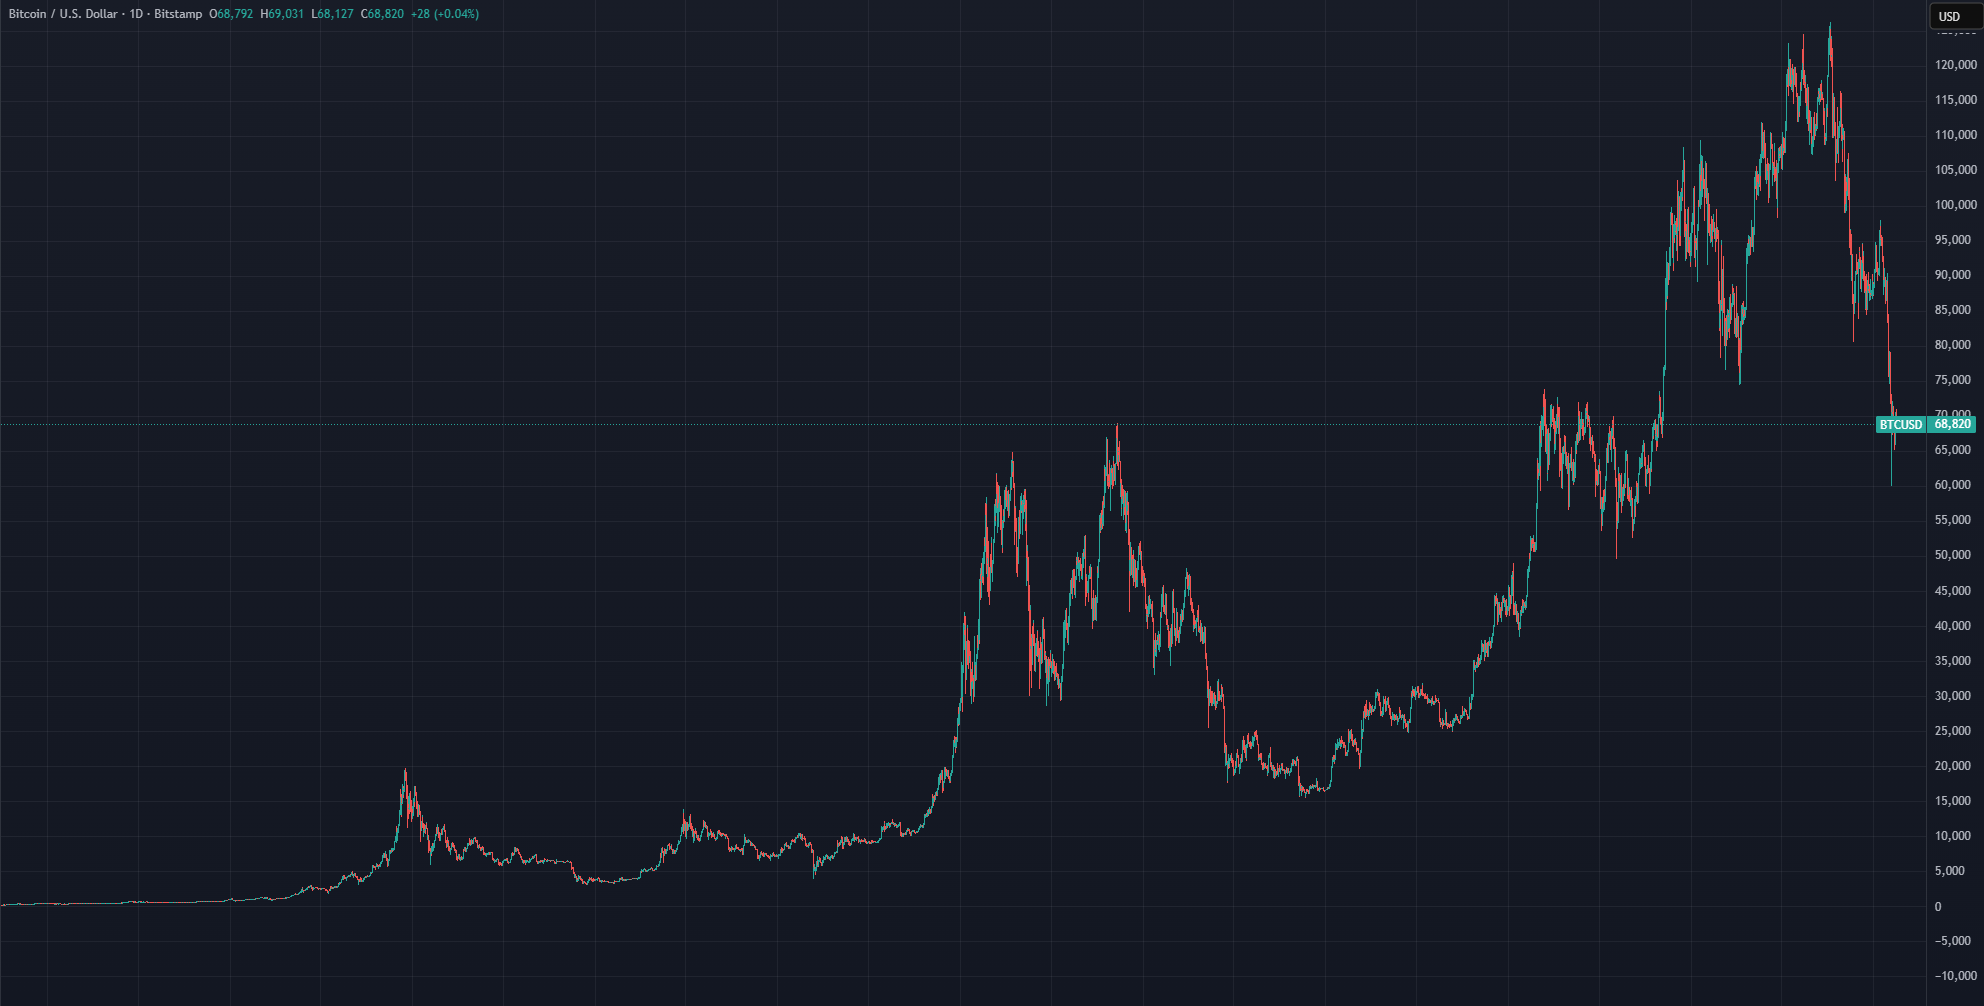
If gold is signalling institutional caution, Bitcoin is signalling something else entirely.
It is signalling leverage.
Bitcoin’s volatility in this cycle is not just about retail sentiment or speculative excess. It reflects a deeper structural shift in how the asset now trades within the global financial system. Bitcoin began as a bearer asset with price discovery occurring largely on-chain. Real buyers took
custody of real coins. Supply was visibly capped at 21 million. Leverage, when present, was often transparent through exchange balances and liquidation data.
That is no longer the full picture.
Over the past several years, Bitcoin has been absorbed into the traditional financial architecture. Spot ETFs, futures, options, perpetual swaps, and structured products now allow exposure without direct ownership. This has created what can be described as synthetic Bitcoin. Financial claims on Bitcoin that exceed the immediate physical movement of coins on-chain.
This does not mean Bitcoin is fraudulent or that its scarcity is invalid. It means price discovery is increasingly influenced by derivatives markets rather than physical accumulation.
And derivatives markets allow leverage.
When volatility rises in the broader system, these leveraged exposures unwind quickly. Liquidations cascade. Funding rates spike or collapse. Price swings accelerate because the most liquid asset absorbs risk first. Bitcoin trades twenty-four hours a day. It is global. It is instantly transferable. That makes it the fastest pressure valve in periods of uncertainty.
In that sense, Bitcoin is less a standalone narrative and more a barometer of systemic stress.
What is important for investors to recognise is that this volatility does not automatically invalidate the long-term thesis for digital assets. It simply reflects the fact that Bitcoin now sits inside the same leverage-driven ecosystem that governs equities, commodities, and credit markets.
In a world where:
• Debt levels remain elevated
• Interest rates are no longer predictably low
• Labour markets are facing automation pressures
• Geopolitical trust is fragmenting
Leverage becomes fragile.
When leverage is fragile, the assets most integrated into derivative markets move first and most violently.
This is why Bitcoin and gold can both rise over longer horizons while experiencing sharp, sometimes confusing short-term drawdowns. One represents a decentralised digital alternative to fiat systems. The other represents a centuries-old monetary hedge. Both sit outside pure sovereign credit risk. Yet both are increasingly traded through financial instruments that introduce leverage.
The key distinction is this.
Gold’s rally has been driven largely by central bank accumulation and reserve diversification. Bitcoin’s volatility has been amplified by derivative expansion and speculative exposure.
These are different drivers, even if both assets are often grouped together as “alternatives”.
For investors, the lesson is not to choose one over the other blindly. It is to understand what role each plays in a portfolio. Gold tends to behave as balance sheet insurance. Bitcoin behaves more like a high-beta hedge on monetary regime uncertainty.
Both are responses to the same macro tension. A debt-based system facing structural questions about growth, productivity, and geopolitical alignment.
And both highlight the same underlying theme.
When the rules of the system feel less predictable, capital looks for assets that sit partially outside it.
4. Japan, Bond Markets, and the End of Cheap Global Money
If gold reflects uncertainty and Bitcoin reflects leverage, then bond markets reflect stress.
And in 2026, one of the most important stress signals is not coming from Washington or Beijing. It is coming from Tokyo.
For decades, Japan quietly underpinned global liquidity.
Through a policy known as yield curve control, the Bank of Japan capped long-term government bond yields, effectively promising markets that borrowing costs would remain suppressed. That stability did not just affect Japan. It fed into the global system.
Cheap yen funding enabled what became known as the carry trade. Capital borrowed at near-zero rates in Japan flowed into higher-yielding assets globally. Equities, emerging markets, US treasuries, credit markets. The system absorbed leverage because the cost of money remained anchored.
When funding is predictable, leverage expands safely. When funding becomes volatile, leverage becomes fragile.
That is the shift we are now witnessing.
Japanese government bond yields have moved to levels not seen in decades. As yields rise, the Bank of Japan faces a difficult trade-off. It can defend its currency by allowing rates to climb, or it can defend its bond market by reintroducing aggressive intervention. It cannot fully do both without consequences.
If Japan tightens to protect the yen, global liquidity tightens with it. The cost of carry increases. Leveraged positions become more expensive to maintain. Risk assets reprice.
If Japan intervenes heavily to suppress yields again, the yen weakens. Imported inflation rises. Capital outflows accelerate. Confidence in long-term currency stability is tested.
Either path introduces friction into a system that became accustomed to effortless funding.
This matters because the global debt structure is deeply interconnected. Japanese institutions hold significant foreign assets, including US treasuries. Stress in Japanese bond markets does not remain domestic. It transmits outward through currency markets, funding markets, and sovereign yields globally.
Recent spikes in global bond volatility are not isolated anomalies. They are signals that the era of universally cheap money is ending.
The past decade allowed investors to assume that central banks would always prioritise liquidity over currency stability. That assumption is now being reassessed.
When the price of money becomes uncertain, every asset must be repriced.
Equities become more sensitive to discount rate changes. Real estate cap rates adjust. Highly leveraged strategies face pressure. Even safe-haven flows can reverse abruptly as capital seeks funding stability rather than pure yield.
This is not a sudden collapse in the bond system. It is a structural recalibration.
The world built enormous leverage during an era of suppressed volatility and anchored rates. Japan was one of the quiet pillars of that architecture. As that pillar shifts, the entire structure must adjust.
For investors, the key takeaway is simple.
Cheap global liquidity is no longer a given. Funding stability is now a variable rather than a constant. And when funding becomes variable, risk premiums rise across asset classes.
That shift sits at the centre of the current macro landscape.
5. When Leverage Retreats, Capital Moves Toward Tangible Income
By this point in the report, the pattern should feel clear. We are not dealing with a single shock event. We are dealing with a system where the cost of money is no longer reliably cheap, where leverage is no longer invisibly safe, and where markets are being forced to reprice uncertainty in
real time. That is what makes this cycle different. It is not collapse. It is adjustment. And in adjustment cycles, capital does not disappear. It relocates.
When funding becomes unstable, investors stop paying for distant promises and start paying for what can be measured today. That is the practical consequence of higher rates, bond market volatility, and an increasingly fragmented geopolitical environment. Long-duration assets suffer because their value depends on a smooth future. Assets tied to visible income and physical use regain relevance because they can be underwritten with fewer assumptions.
This shift usually happens quietly at first. It shows up as preference changes in portfolio construction rather than dramatic headline moves. Investors shorten their time horizons, reduce reliance on leverage, and begin favouring assets where return is driven by cash flow rather than multiple expansion. You see it when “boring” sectors start outperforming, when balance sheet quality matters again, and when investors become more sensitive to liquidity and funding conditions than to growth narratives.
There are a few consistent behaviours that tend to emerge in this phase:
• higher demand for assets with income visibility today, not theoretical upside later
• lower tolerance for leverage where refinancing risk is rising
• greater preference for scarcity, utility, and physical constraint rather than synthetic exposure
This is where the link to real assets becomes important. Real assets are not magical, and they are not immune to cycles. But they do have a structural advantage in environments like this. Their value is anchored in physical demand and constrained supply, not in financial abstraction. Land does not get created because a derivative market expands. A logistics corridor does not become less useful because equities reprice. Housing demand does not vanish because a funding curve shifts. When markets are unstable, that grounding matters.
It is also where the “system paradox” from earlier sections begins to matter for strategy. If debt-based systems depend on future income growth, and if the AI productivity story implies labour income could become less stable over time, then the premium on tangible scarcity rises. That does not mean financial assets stop working. It means the market starts assigning a higher value to assets that sit outside the most fragile part of the system. The fragility is not in productivity itself. It is in the cash flow assumptions that debt and leverage require to remain safe.
This is why we tend to see real assets reassert themselves during transitional periods. Not necessarily through dramatic price spikes, but through relative stability and improved capital allocation. In other words, they become the place capital hides while it decides what to do next.
And that brings us directly to our bridge into positioning. Because once investors accept that uncertainty is not temporary noise but a condition, the question becomes less about timing markets and more about constructing resilience.
If the world is shifting toward a regime where funding is more expensive, leverage is less reliable, and policy alignment is harder to forecast, then portfolios have to be built around durability.
That is where diversification stops being a slogan and becomes a discipline.
And in the next section, we make it practical. We move from the global macro argument into where capital can still find measurable outcomes, stable income dynamics, and structural demand. This is where New Zealand and Malaysia begin to make sense, not as headline trades, but as middle-ground markets that benefit when the global system deleverages and real assets regain strategic weight.
6. A Diversification Framework for Transitional Cycles
Positioning Capital in a Leverage-Sensitive Cycle
If the earlier sections of this report describe a system under controlled stress, this section addresses the practical question that follows.
How should capital be positioned when leverage is unstable, geopolitics is fragmenting, and traditional correlations are less reliable than they once were?
Transitional cycles tend to punish concentration and reward structure. In expansion phases, bold directional bets can be amplified by liquidity and momentum. In adjustment phases, fragility is exposed first in the most leveraged and narrative-driven segments of the system. The objective shifts from maximising upside to preserving optionality.
The Limits of Single-Asset Conviction
No single asset class currently offers both stability and growth without meaningful trade-offs.
Gold has surged to new highs. Its strength reflects demand for monetary insurance in a world where sovereign debt levels remain elevated and trust between nations is increasingly questioned. Central banks are diversifying reserves. Investors are reassessing long-term currency stability. Gold performs well in this environment because it sits outside the liability structure of any single government.
However, gold does not produce income. It preserves purchasing power, but it does not compound. In extended periods of volatility, that distinction matters. Protection without yield can stabilise portfolios, but it does not drive forward returns on its own.
Bitcoin offers a different profile. It is scarce by design, yet its price discovery is increasingly influenced by derivatives markets, ETFs, and institutional leverage. It trades continuously and often reacts to liquidity stress before traditional markets. This makes it an early barometer of risk appetite, but also a source of significant short-term volatility.
Bitcoin provides asymmetry and long-term optionality, yet it requires tolerance for drawdowns that many investors underestimate.
Equities remain tied to forward earnings assumptions. When labour markets soften, productivity expectations become uncertain, and interest rates remain volatile, valuation multiples come under pressure.
Bond markets, once considered reliable counterweights, now reflect structural debt expansion across developed economies. The traditional 60/40 framework depends on stable correlations. Those correlations are being tested.
In this environment, diversification is not about spreading capital randomly across asset classes. It is about understanding what each component contributes to portfolio behaviour.
Real Assets in a Leverage Reset
Periods of monetary transition and leverage reassessment tend to elevate the value of tangible income.
Income-producing property and operational industrial assets are tied to physical demand and contractual cash flow. They do not rely primarily on financial engineering or synthetic leverage to generate returns. While they are not immune to cycles, their performance is grounded in occupancy, rental covenants, and supply constraints.
When leverage tightens across the system:
• Visible and recurring income becomes more valuable
• Speculative growth assumptions are discounted more aggressively
• Assets with multiple exit pathways gain importance
This dynamic is particularly relevant in a debt-based system under strain. If future growth assumptions are being questioned, assets that generate present cash flow gain relative attractiveness.
Historically, when debt-driven expansions encounter stress or reset phases, the subsequent cycle often rewards holders of tangible, income-producing assets. Paper claims fluctuate with liquidity. Real assets compound through use.
Diversification as Structure, Not Pessimism
The objective in 2026 is not to predict a single outcome. It is to structure capital so that it remains functional across multiple outcomes.
The emphasis shifts from maximising returns under one scenario to reducing fragility across several.
This does not imply pessimism. It reflects discipline.
Transitional cycles rarely reward extreme positioning. They tend to reward investors who maintain liquidity, income visibility, and structural exposure to real economic activity.
That naturally leads to the final question.
If global capital is seeking balance rather than extremes, which jurisdictions offer yield, policy clarity, and tangible demand at the same time?
7. New Zealand and Malaysia
Policy Clarity, Currency Strength, and Real Asset Positioning in 2026
After examining leverage, gold, Bitcoin, and bond markets, the question becomes practical.
Where can capital sit while the system recalibrates?
In transitional cycles, investors gravitate toward jurisdictions where three variables align:
• Policy visibility
• Currency stability
• Tangible, income-producing demand
New Zealand and Malaysia meet those conditions today, though through different channels.
New Zealand: Stabilisation After Tightening
New Zealand is no longer fighting inflation. It is managing the after-effects of tightening.
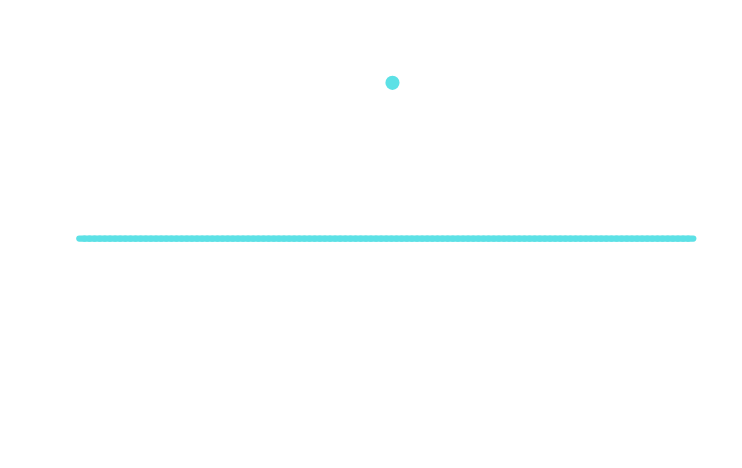
The Official Cash Rate now sits at 2.25 percent as of early 2026. Inflation has moderated toward the low 2 to 3 percent range. Monetary policy has clearly shifted from restrictive to neutral-to-supportive.
This matters because real assets typically reprice not when rates are cut aggressively, but when policy credibility is restored and borrowing costs fall faster than income.
The tightening cycle has already passed through property valuations. What remains is a supply environment that is materially more disciplined than during the 2021–2022 construction peak.
Residential consents remain well below prior highs across stand-alone homes, townhouses, and apartments. Development margins have been compressed. Credit conditions have been tighter. The result is reduced forward supply.
Historically, New Zealand property cycles bottom when supply contracts rather than when demand surges. Occupancy firms first. Rental stability follows. Capital values recover later.
Transaction activity is also rebuilding gradually rather than explosively.
Volumes through 2025 and into early 2026 show recovery from trough levels without speculative acceleration. This is characteristic of early-cycle stabilisation, not late-cycle exuberance.
On the policy front, housing remains central to New Zealand’s economic management framework. Migration inflows have normalised from peak surges, construction activity has cooled, and lending standards remain measured. There has been no abrupt deregulation that would reintroduce overheating risk.
Currency positioning adds further asymmetry.
The New Zealand dollar, although recently strengthening against the USD to the 0.60 region, remains below its long-term average. For offshore investors funding in stronger currencies, entry pricing remains favourable. Income is earned locally while currency normalisation, if it occurs, becomes incremental upside rather than a required component of return.
New Zealand today offers clarity rather than excitement. In a fragmented global environment, that is precisely what capital seeks.
Malaysia: Yield Premium with Currency Momentum
Malaysia is positioned differently but equally relevant in this cycle.
Bank Negara’s Overnight Policy Rate stands at 2.75 percent, after the 2025 adjustment phase. Inflation has moderated into the low-to-mid 1 percent range, creating a positive real yield environment without requiring restrictive conditions.
Policy stability is critical in emerging markets. What differentiates Malaysia currently is not just rate stability, but currency performance.
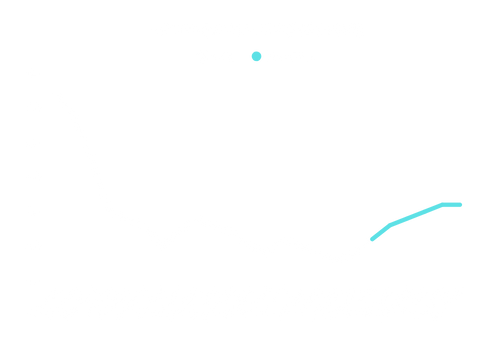
As of February 2026, USD/MYR has continued trending lower toward the 3.9 region, reflecting a strengthening ringgit relative to prior years.
The ringgit is now trading near or above its longer-term average line. This shifts Malaysia’s positioning meaningfully. Currency risk, which historically required compensation, is increasingly becoming neutral or even supportive for foreign investors.
That changes capital behaviour.
Malaysia continues to absorb real economic activity rather than speculative inflows. Demand drivers remain broad-based:
• Port logistics and trade corridors
• Manufacturing relocation within ASEAN
• Semiconductor and data centre spillover
• Infrastructure connectivity including Johor-Singapore integration
This diversification of demand reduces thematic fragility. Real estate income is anchored in operating cash flow rather than hype.
Yields in prime logistics and industrial assets remain materially above developed market benchmarks. In a world where global rates are easing but risk premia are rising, that yield differential becomes more valuable.
In a world where leverage is being unwound and synthetic liquidity is questioned, capital increasingly prefers assets grounded in physical demand, measurable income, and policy transparency.
Both jurisdictions provide that.
They are not momentum trades. They are allocation trades.
And in transitional cycles, allocation trades tend to outperform narrative trades.
8. Featured Listings: The Strategic Middle Ground
New Zealand: The Geopolitical Safe Haven, Locking in Yield Far from the Friction

Canterbury - Integrated Retirement Village & Care Facility
Type: Aged Care & Rest Home Facility
Indicative Pricing: ~NZD 24.5m
Indicative Net Yield / Cap Rate: ~8.8%–10.5%
Occupancy: 100%
Site / Building: ~2.5 ha land
Notes:
The asset combines recurring rental income from independent villas with higher-yielding care bed revenue, creating a blended income profile. Recent refurbishments to common areas and compliance upgrades reduce near-term capex exposure.
Care occupancy across Canterbury remains structurally tight due to limited new development and rising build costs.
Investment Potential:
Defensive sector tied to demographic inevitability
Blended income model across rental and care fees
Limited pipeline competition due to construction costs
Suitable for hold-and-optimise strategy or institutional healthcare exit

East Tamaki - High-Spec Logistics Facility
Type: Modern logistics / distribution facility
Indicative Pricing: ~NZD 55.0m
Indicative Net Yield / Cap Rate: ~7.5%–8.0%
Occupancy: ~90%–100% (range depending on final lease profile)
Building: ~100,000 sq ft (approx.)
Notes:
East Tamaki is one of NZ’s most liquid industrial precincts with structurally tight vacancy. In environments where trade routes and supply chains get re-optimised, premium logistics locations often benefit first through stronger tenant demand and pricing power.
Investment Potential:
“Quality logistics” exposure with strong re-leasing defensiveness
Rental uplift potential in low-vacancy micro-markets
Exit options: institutional buyer or logistics-focused REIT mandate

Auckland Fringe - Dual-Tower Office Complex (Core-Plus + Optionality)
Type: CBD-fringe office / mixed-use optionality
Indicative
Asking: ~NZD 40.0m
Indicative Cap Rate: ~7.0% (approx.)
Occupancy: ~90%
Site / Building: ~4,000 m² land | ~12,500 m² built (dual towers)
Notes:
This is less a “pure office” bet and more an optionality bet: location, transport connectivity, and nearby education/amenity nodes can support repositioning pathways over time. In an adjustment cycle, assets with multiple feasible end-states can be more resilient than single-use assets.
Investment Potential:
Core-plus carry while executing leasing/repositioning
Value creation path: staged re-leasing + targeted upgrades (not full redevelopment)
Optionality lens: explore conversion feasibility (where permitted) or hybrid tenant mix to reduce single-sector risk
Malaysia: The Energy Pivot, Leveraging Supply Chain Shifts and Regional Stability

Klang Valley – Corporate Tower (En-Bloc Opportunity)
Indicative Pricing: ~MYR 110.5m – 228.0m
Indicative Net Yield: 5.5% – 6.8%
Type: Grade A Corporate Office Tower (MSC Malaysia Cybercentre)
Occupancy: 80% – 100%
Land / Building: 126,000 sq ft
Notes:
A premier 2026 investment asset within a 9.38-acre integrated development. This boutique office tower offers naming rights and a high-profile presence in one of the Klang Valley's most successful fringe business parks. It is specifically designed for multinational corporations and tech-driven enterprises requiring MSC status.
Investment Potential:
Capital Gains: Capital values in the area have remained resilient due to the lack of new Grade A supply on the Subang fringe.
Yield Stability: The MSC status allows for a wider pool of international tenants, ensuring a defensive income stream even in volatile markets.
Accessibility: Unrivaled logistics connectivity via the Federal Highway, LDP, and NKVE, making it a preferred choice for companies moving away from the congested KL CBD.

Johor – Large-Scale Industrial Warehouse
Indicative Pricing: ~MYR 100.0m
Type: Industrial | Single-storey warehouse with 29 dock levellers
Tenure: Freehold
Land / Building: ~9.37 acres | ~176,400 sq ft built
Power Supply: ~1,200 Amp
Nearby Demand Drivers: Senai Airport Logistics Hub, YTL–NVIDIA AI corridor, Johor–Singapore connectivity zone
Notes:
This is one of the larger freehold logistics assets currently available in Johor’s northern industrial belt. Its scale, dock configuration, and high-power capacity make it well suited for regional warehousing, hardware staging, and distribution functions supporting Johor’s rapidly evolving technology and data ecosystem.
The surrounding corridor has experienced visible land value appreciation, driven by increasing hyperscaler, semiconductor, and cross-border logistics activity linked to Johor–Singapore connectivity.
Investment Potential:
Rare freehold industrial platform with long-term redevelopment optionality
Strong alignment with Johor’s emerging AI, cloud, and data-adjacent infrastructure corridor
Potential to transition from pure logistics into higher-value, power-intensive use over time
Clear institutional exit pathways as Johor matures into a regional logistics and digital hub
Want to discuss any of these opportunities further? Reach out to our team directly:
Contact Information :
Petrus Yen - Managing Director
Petrus@fairhavenproperty.co.nz
Daarshan Kunasegaran
Daarshan.Kunasegaran@fairhavenproperty.co.nz
Disclaimer:
The property details, financial figures, and projections provided in this article are based on publicly available information and internal estimates. They are intended for informational purposes only and do not constitute financial advice or an offer to invest. Projections such as IRR and equity multiples are indicative only and subject to change based on market conditions, financing terms, and execution strategy. Interested parties should conduct independent due diligence and consult with a qualified advisor before making any investment decisions. Fairhaven Property Group accepts no liability for decisions made based on the information presented herein.