
As we enter the second quarter of 2026, the global narrative has shifted from crisis to stabilisation, but without clear direction.
Markets are no longer reacting to a single disruptive shock. Instead, they are adjusting to a prolonged period of equilibrium where key variables are improving, but not decisively enough to drive conviction.
In early April, oil prices briefly moved above USD 100 per barrel amid renewed geopolitical tensions, highlighting how sensitive inflation remains to energy markets. While prices have since moderated, the episode reinforced a broader reality. Central banks are no longer tightening aggressively, but they are also not in a position to ease meaningfully.
In New Zealand, the Official Cash Rate remains at 2.25%, while inflation is still elevated at around 3.1%. In Malaysia, the Overnight Policy Rate is holding at 2.75%, supported by inflation of approximately 1.6% and steady GDP growth expectations of 4% to 5%.
Individually, these indicators suggest stability. Collectively, they point to a more cautious environment.
The global economy is no longer deteriorating, but it is not yet strong enough to support broad-based risk-taking. Growth is returning, but gradually. Policy is stable, but not yet supportive. As a result, capital is not exiting the market, but it is not deploying with urgency either.
This has created a widening gap between improving fundamentals and investor conviction.
For investors, the key question is no longer when recovery will become obvious, but where capital is already beginning to reposition ahead of it.
This edition covers:
The current macro environment of stabilisation without urgency
How interest rates, inflation, and growth expectations are shaping investor behaviour
The emerging divergence between core and non-core property segments
Why capital remains on the sidelines despite improving fundamentals
The concept of the “wait-and-see” penalty in a gradual recovery cycle
The property outlook in New Zealand and Malaysia within this evolving environment
1. Structural Stability, But Limited Conviction
The global macro environment in 2026 is increasingly defined by stability without strong conviction.
Following an extended tightening cycle, central banks have moved into a holding phase. Interest rates are no longer rising aggressively, but they are not declining in a meaningful way either. This has created a period of equilibrium where downside risks are reduced, but upside momentum remains limited.
Recent volatility in oil prices, with Brent crude briefly touching USD 100 per barrel, served as a reminder that inflation risks have not fully disappeared. While headline inflation has moderated from previous peaks, it remains above long-term targets in several economies.
In New Zealand, inflation is currently around 3.1% against an OCR of 2.25%. In Malaysia, inflation remains more contained at approximately 1.6%, with policy rates steady at 2.75%.
At the same time, growth expectations remain modest. Forecasts for 2026 suggest GDP expansion of between 1.8% and 2.7% in New Zealand, while Malaysia continues to project growth in the 4% to 5% range.
These are not recessionary conditions. They reflect a system that is stabilising, but not accelerating.
This is where the lack of conviction becomes most visible.
Institutional capital is not exiting real assets, but it is also not deploying at the pace seen in previous cycles. A significant portion of the market remains on the sidelines, waiting for clearer signals such as confirmed rate cuts, stronger growth data, or reduced geopolitical risk.
The challenge is that markets rarely wait for clarity.
By the time macro conditions appear fully supportive, pricing adjustments are often already underway. For forward-looking investors, the focus shifts from reacting to confirmation toward identifying where capital is quietly beginning to move.
2. A Gradual Recovery and the Cost of Inaction
The current cycle is shaping up to be a gradual recovery rather than a sharp turning point.
Recent guidance from global institutions and regional banks suggests that 2026 will be defined by steady but uneven expansion. New Zealand’s GDP is expected to grow between 1.8% and 2.7%, while Malaysia’s outlook remains stronger at approximately 4% to 5%.
However, gradual growth often leads to divergence.
In a slower expansion environment, performance is no longer driven by broad market momentum. Instead, differences between asset classes, sectors, and locations become more pronounced. Average market returns become less relevant, and asset selection plays a larger role in determining outcomes.
This is where the cost of inaction becomes most evident.
Many investors continue to adopt a wait-and-see approach, holding back capital until there is greater certainty around interest rates and economic direction. While this may reduce perceived risk, it introduces a different kind of cost.
The first is the erosion of yield advantage. In the current environment, secondary and income-focused assets are offering higher yields relative to prime assets. As confidence gradually returns, these yield spreads tend to compress first, as capital flows into underpriced segments.
The second is the opportunity cost of liquidity. In both New Zealand and Malaysia, certain sectors are already benefiting from structural demand drivers that are not fully reflected in headline GDP growth. Industrial and logistics markets, particularly in key growth corridors, continue to see strong underlying demand despite cautious sentiment at the macro level.
The third is timing. Historically, real asset pricing begins to recover before policy easing becomes visible. By the time interest rate cuts are confirmed, much of the repricing has already taken place.
In this type of environment, waiting for a clear turning point can result in entering the market after the initial phase of value creation has passed.
The focus, therefore, shifts from identifying a single moment of recovery to recognising where momentum is already building beneath the surface.
In the following sections, we examine how these dynamics are playing out across New Zealand and Malaysia, and where early signs of repricing are beginning to emerge.
3. New Zealand: Stabilisation in Pricing, Divergence in Yields
The New Zealand economy is currently operating within a “hawkish pause” environment. As of early 2026, the Reserve Bank of New Zealand has held the Official Cash Rate at 2.25% following a sustained easing cycle through 2025.
While this signals that the most restrictive phase of policy has passed, conditions are not yet accommodative enough to drive a broad recovery in asset markets.
Inflation vs Policy: A Narrowing but Sticky Gap
Inflation has moderated from previous highs but remains elevated at approximately 3.1%, still above the central bank’s target range.
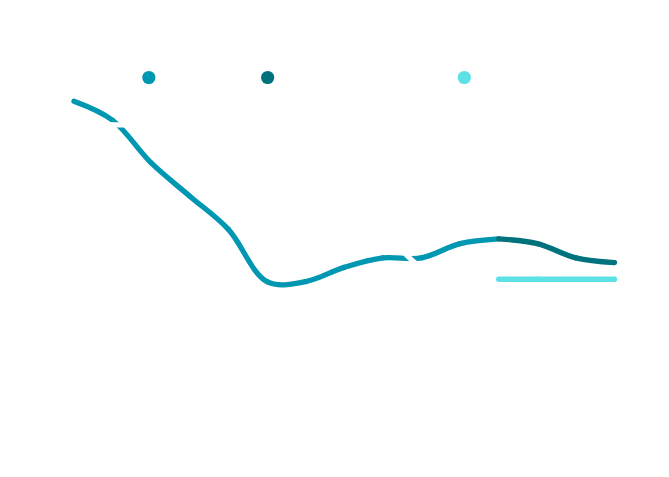
The chart shows a clear compression between inflation and the OCR. Earlier in the cycle, inflation significantly outpaced interest rates, forcing aggressive tightening. Today, that gap has narrowed, but not fully closed.
This is important because it signals that policy is no longer tightening, but also not ready to ease. Real rates remain only marginally restrictive, which explains the current holding pattern across markets.
For investors, this creates a transitional phase where financing conditions are stable, but not yet supportive enough to trigger aggressive capital deployment. It is typically within this window that early repricing begins, before policy fully shifts.
Currency Stability and Industrial Demand
The NZD/USD exchange rate has remained relatively stable, trading within the 0.60 range in recent periods.
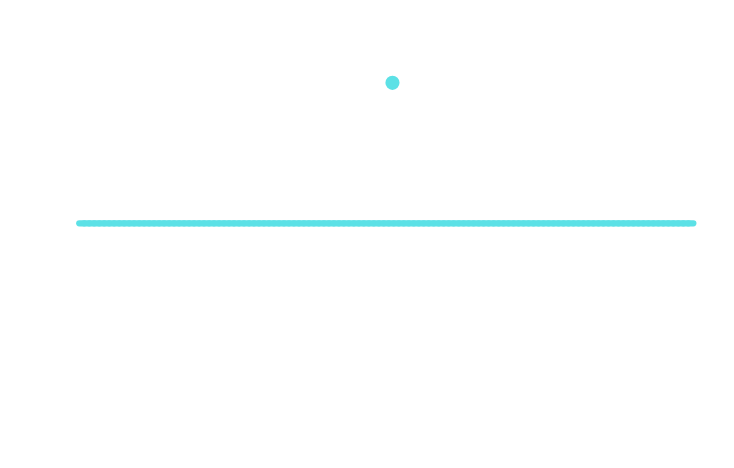
The long-term chart shows that the currency is neither at a cyclical high nor under significant pressure. This stability is critical for export-oriented sectors, particularly agriculture, manufacturing, and logistics.
A stable currency environment supports consistent demand for industrial space, especially in key hubs such as South Auckland and Christchurch. Vacancy rates in these areas remain below approximately 3%, indicating that underlying demand is being driven by real economic activity rather than speculative cycles.
This reinforces a key divergence in the market. While broader sentiment remains cautious, income-generating industrial assets continue to perform based on fundamentals rather than macro expectations.
Supply Dynamics: From Contraction to Early Recovery
Construction activity has slowed materially from its peak, with total dwelling consents declining from over 48,000 annually in 2022 to the mid-30,000 range in 2024 and 2025.
However, more recent data shows a modest uptick into 2026.
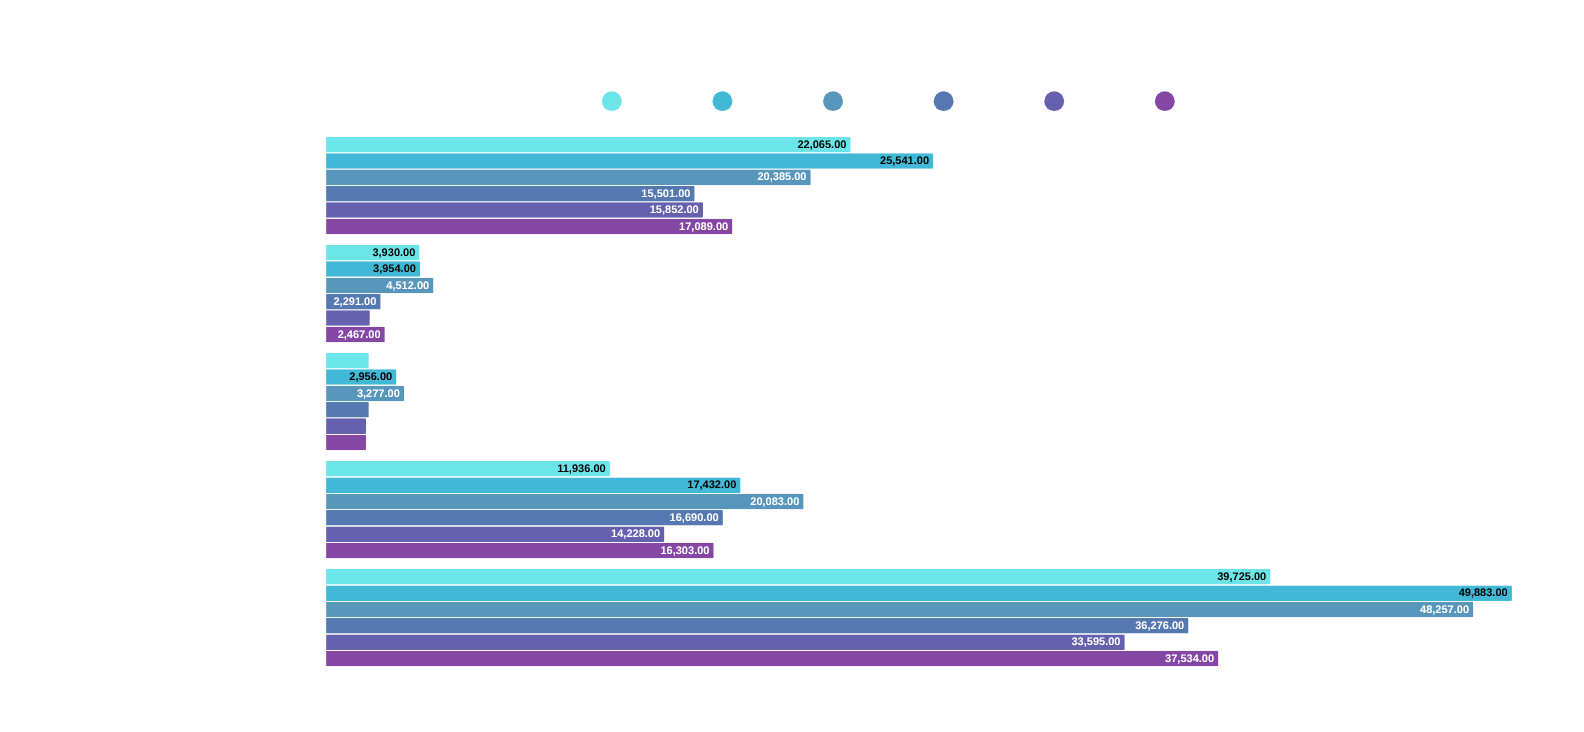
At first glance, the increase in 2026 consent numbers may suggest a recovery in supply. In reality, it reflects a normalisation from suppressed levels rather than a return to oversupply.
The earlier decline in consents was driven by high financing costs and reduced developer activity. The recent increase indicates that developers are beginning to respond to stabilising conditions, but the pipeline remains well below previous peak levels.
This creates a lag effect. Even with a slight recovery in approvals, the overall supply entering the market over the next 12 to 24 months is still constrained relative to demand.
For investors, this is a critical signal. The market is transitioning from oversupply risk to potential supply tightness, particularly in growth corridors. Assets with existing income streams and strong utility stand to benefit first, as new supply remains limited in the near term.
Market Insight
New Zealand is no longer in a broad correction phase, but the recovery is uneven and still developing.
Policy has stabilised at 2.25%, inflation remains above target at around 3.1%, and while construction activity is showing early signs of recovery, the overall supply pipeline remains constrained.
At the same time, transaction activity has yet to fully rebound. This reflects a disconnect between improving fundamentals and investor behaviour.
This gap is where early-stage repricing typically emerges. Segments supported by income, tenant demand, and limited supply are beginning to adjust ahead of the broader market, while capital remains cautious at the headline level.
4. Malaysia: Stable Macro, Stronger Underlying Momentum
Malaysia continues to demonstrate relative macroeconomic stability, supported by consistent growth, contained inflation, and stable policy settings.
Following approximately 6.3% GDP growth in late 2025, projections for 2026 remain within the 4% to 5% range, positioning Malaysia as one of the more resilient economies in the region.
Monetary Stability and Cost of Capital
Bank Negara Malaysia has maintained the Overnight Policy Rate at 2.75%, with no clear signal of imminent easing.
The chart reflects a flattening of the rate cycle, indicating that the tightening phase has concluded. Unlike more volatile markets, Malaysia’s policy environment has transitioned into a period of stability.
This stability reduces uncertainty around financing costs, allowing investors to underwrite assets with greater confidence. However, it has also contributed to a wait-and-see mindset, as some investors continue to anticipate future rate cuts before deploying capital.
The result is a market where conditions are supportive, but capital is not yet fully active.
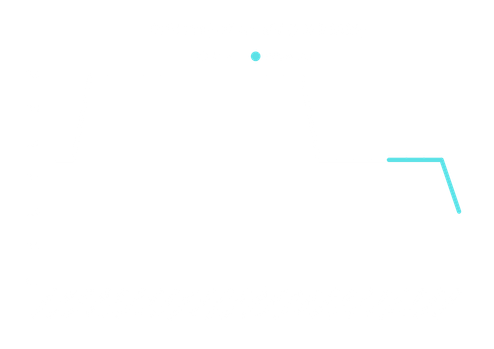
Currency Positioning and Capital Flows
The Malaysian Ringgit has shown signs of stabilisation after a prolonged period of weakness against the U.S. dollar.
The long-term trend suggests that the currency has moved out of its most volatile phase and is now trading within a more stable range.
For cross-border investors, this reduces a key layer of risk. When currency volatility declines, investment decisions shift away from defensive positioning toward asset-level performance.
This is particularly relevant in Malaysia, where stable currency conditions are coinciding with increased foreign interest in industrial and logistics assets, especially within Johor and the broader southern corridor.
Inflation and Real Yield Advantage
Malaysia’s inflation remains contained at approximately 1.6% to 1.8%, significantly lower than most developed markets.
The chart highlights a stable and low inflation environment, which has important implications for real estate investors.
In higher inflation markets, rental growth is often offset by rising costs, limiting real returns. In Malaysia, lower inflation allows rental income to translate more directly into real yield.
This creates a favourable environment for income-producing assets, particularly in sectors where demand is supported by structural drivers such as manufacturing, logistics, and cross-border trade.
Market Insight
At a headline level, Malaysia reflects stability. However, underlying performance is increasingly concentrated in specific sectors.
While office markets remain relatively subdued, industrial and logistics assets are benefiting from strong demand drivers, including approximately RM91 billion in approved investments in Johor in 2025.
This indicates that capital is already moving, but selectively.
The broader takeaway is that stability at the macro level is not limiting opportunity. It is narrowing the field, directing capital toward segments where demand is supported by real economic activity rather than cyclical sentiment.
5. The "Wait-and-See" Penalty: Why the Fringe is the Hedge
In professional investment circles, there is a common adage: "The crowd is most comfortable when the risk is highest." Today, the "crowd" is waiting for comfort. They are waiting for a clear signal from the central banks, a definitive sequence of 25-basis-point cuts, to validate their entry into the market. But in the world of high-yield real assets, waiting for comfort is a strategy that carries a heavy, albeit invisible, price tag. We call this the Wait-and-See Penalty.
The Mechanics of the Penalty When the macroeconomic environment is "gradual" or "uncertain," the risk premium on fringe assets expands. Because these assets, industrial warehouses, suburban centers, and CBD-fringe service hubs, are perceived as less "prestigious" than a glass-and-steel tower in the heart of Auckland or Kuala Lumpur, they are the first to be discounted during a period of high interest rates.
However, as we have noted in previous reports, these are often the assets with the highest Utility Value. They are the "engine rooms" of the economy. By waiting for the "all-clear" signal, investors face three specific penalties:
The Yield Compression Trap: Currently, we are seeing a "Yield Gap" where fringe assets are yielding 200–300 basis points above prime CBD assets. As soon as the OCR begins its downward trajectory, this gap will close rapidly. The 8.5% yield you can secure today in a fringe asset will likely be a 6.5% yield by this time next year.
The Refinancing Pivot: Those who acquire assets during the "uncertainty phase" at higher yields are perfectly positioned to refinance when rates eventually drop. This creates a "double-win": you secure the asset at a lower entry price today and amplify your cash-on-cash return tomorrow through lower debt servicing.
The Supply-Side Squeeze: In both New Zealand and Malaysia, construction starts for commercial and industrial projects have plummeted over the last 18 months. We are heading toward a "supply cliff." When the "Wait-and-See" crowd finally decides to buy, they will find a market with almost zero vacant stock and skyrocketing replacement costs.
The hedge against a sideways market isn't cash; it is Cash Flow. By shifting focus to high-yield fringe assets, investors aren't just waiting for the recovery, they are getting paid to wait.
6. Featured Listings: Not Distress, But Hesitation
While many investors remain on the sidelines awaiting clearer signals, underlying fundamentals across selected segments have already begun to stabilise. In this phase of the cycle, opportunities are less about broad market timing and more about identifying assets where income, demand, and supply dynamics are already aligned.
The following opportunities reflect this positioning. Each asset sits within a segment where fundamentals are intact, and where pricing may not yet fully reflect the next phase of market repricing.
New Zealand
Tauranga - Multi-Unit Residential
Property Type: Residential Apartment Complex
Estimated Value: ~NZD 40 million
Estimated Yield: ~6%
Land Area: ~2,600 sqm
Floor Area: ~4,500 sqm
Units: 55 apartments
Notes:
A recently constructed multi-level apartment complex located within Tauranga’s established city-fringe residential precinct. The development comprises 55 contemporary apartments held under individual unit titles, providing flexibility for potential staged sell-down strategies while continuing to generate consolidated rental income.
Investment Potential:
With new housing supply moderating and development pipelines still below prior peaks, existing residential assets in high-demand locations are positioned to benefit from tightening supply conditions. Proximity to key amenities and tertiary institutions supports ongoing rental demand, while the scale of the asset allows for both stable income and potential future flexibility through staged divestment.
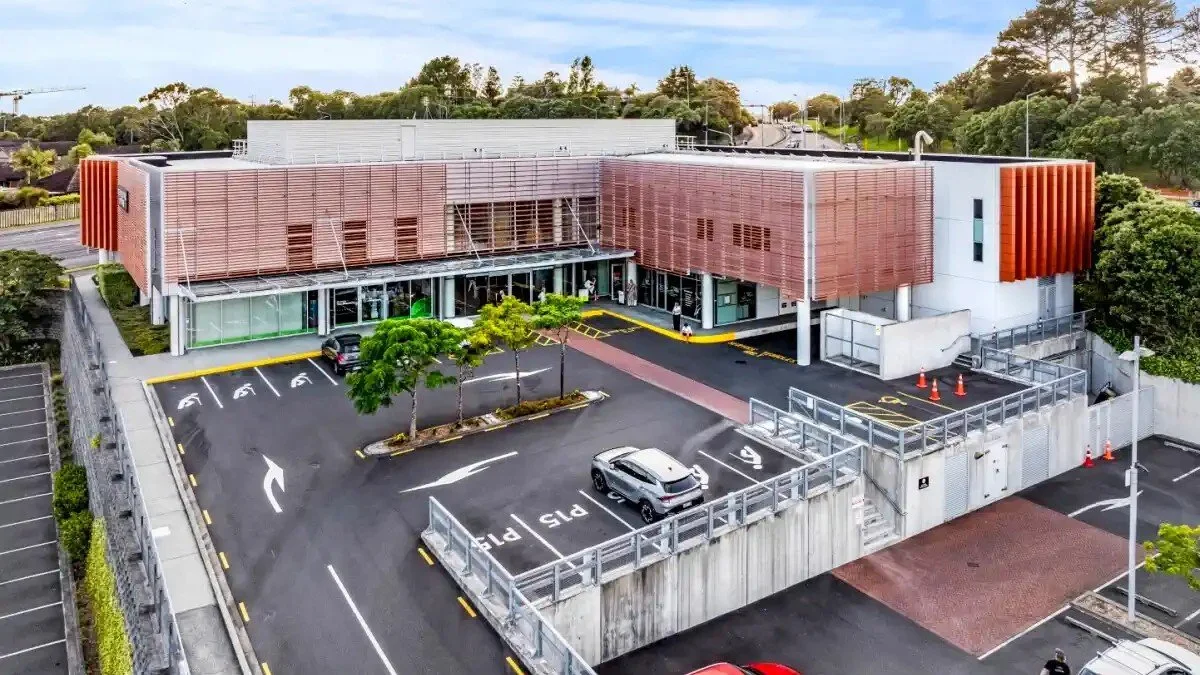
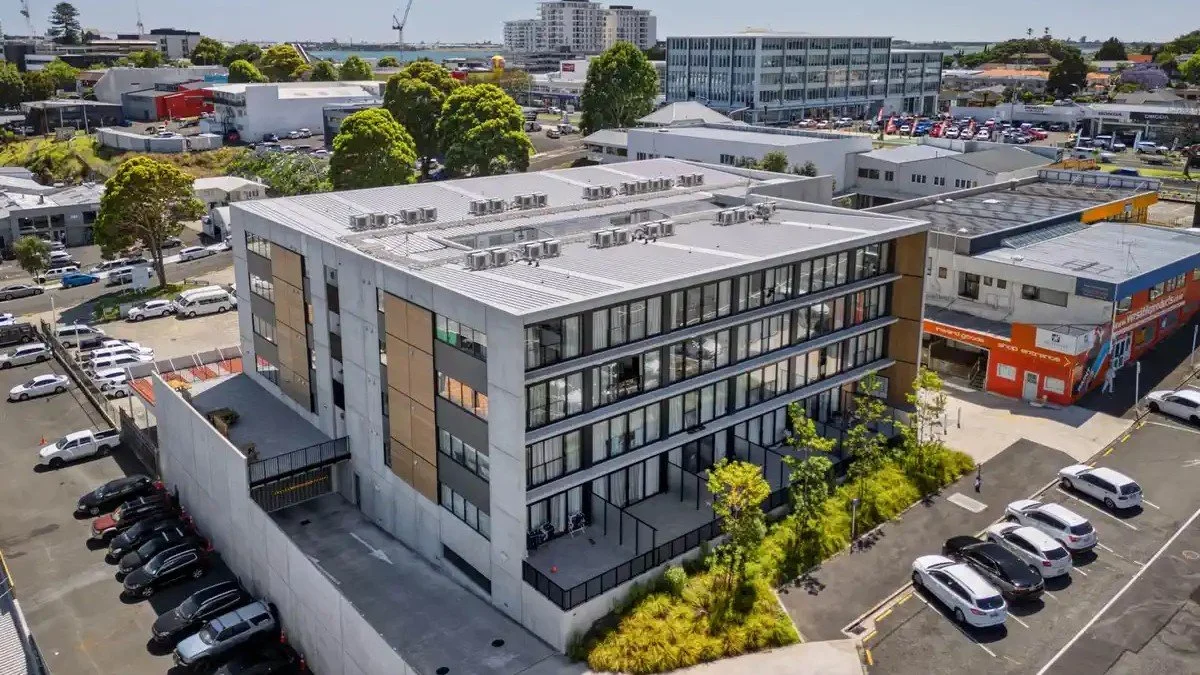
Auckland - Healthcare Commercial Asset
Property Type: Medical / Healthcare Facility
Estimated Investment Value: ~NZD 30 million
Estimated Yield: ~6%
Land Area: 6,048 sqm
Floor Area: 3,149 sqm
Notes :
A purpose-built healthcare facility positioned within one of Auckland’s rapidly expanding suburban corridors. The asset hosts a wide range of medical services serving the surrounding residential population and benefits from strong building quality and extensive onsite parking.
Investment Potential:
Healthcare assets benefit from non-discretionary demand, providing resilience across economic cycles. In the current environment, assets with stable tenant profiles and long-term service demand are likely to reprice ahead of broader commercial segments. The scale and configuration of the site also provide optionality for future repositioning into complementary uses such as specialist care, childcare, or community-based services. These alternative uses could further enhance rental income potential over time.
Waikato - Regional Commercial Asset
Property Type: Commercial / Industrial
Estimated Investment Value: ~NZD 8.5 million
Estimated Yield: ~8%
Land Area: 1,011 sqm
Floor Area: 1,609 sqm
Notes:
A commercial property located within the South Waikato economic corridor supporting industrial and operational tenants. The property benefits from a strong building-to-land utilisation ratio and commercial zoning that supports a range of tenant uses.
Investment Potential:
Regional commercial assets continue to offer yield premiums relative to metropolitan markets. With industrial vacancy rates remaining tight and new supply constrained, income-generating assets in secondary locations are increasingly attractive. In a stabilising rate environment, these higher-yield segments are often among the first to see pricing compression as capital re-enters the market.
Malaysia
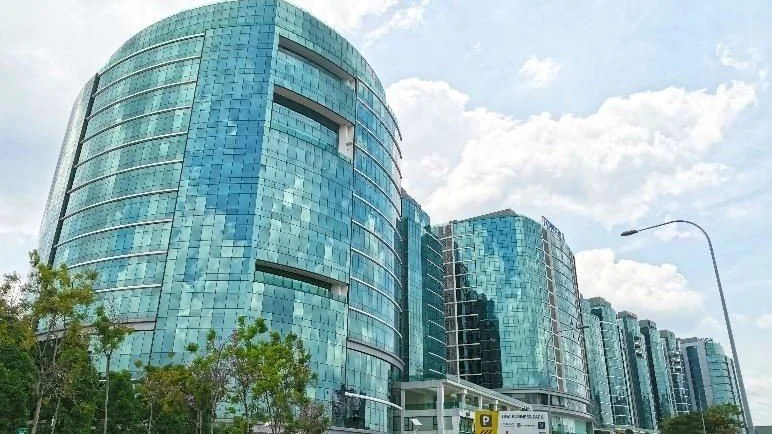
Subang Jaya - Corporate Office Tower
Property Type: Grade A Corporate Office Tower
Estimated Investment Value: ~RM 120 million
Estimated Yield: ~6%
Floor Area: ~126,000 sq ft
Tenure: Freehold
Notes:
A boutique Grade A office asset within an established commercial hub, offering strong connectivity and positioning within a mature mixed-use development.
Investment Potential:
Office developments along the Subang fringe have historically maintained resilient demand due to their strategic location between Kuala Lumpur’s CBD and the major industrial hubs of Shah Alam and Klang. As corporations continue to decentralise operations away from the congested city centre, well-connected suburban Grade A offices have become increasingly attractive.
The tower’s MSC Malaysia Cybercentre designation further expands the tenant pool by attracting technology firms and multinational companies seeking digital infrastructure and regulatory incentives. Combined with limited new Grade A supply in the immediate corridor, the asset offers potential for stable tenancy and long-term capital appreciation.
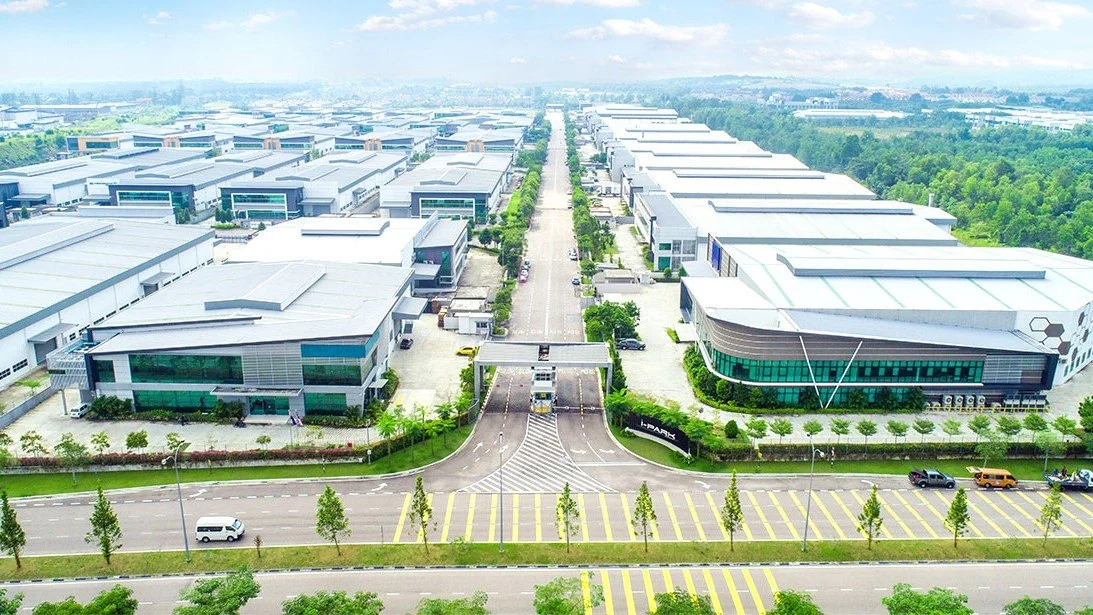
Iskandar Puteri - Industrial Manufacturing Facility
Property Type: Detached Industrial Factory with Office
Estimated Investment Value: ~RM 55 million
Estimated Yield: ~7%
Land Area: ~150,447 sqft
Floor Area: ~109,179 sqft
Ceiling Height: ~9 metres
Power Supply: ~1,000 Amp
Notes:
A large-scale detached industrial facility located within the Southern Industrial and Logistics Cluster (SiLC) in Iskandar Puteri. The property comprises a single-storey factory building integrated with a two-storey office component designed to support manufacturing, warehousing, and logistics operations.
Investment Potential:
Industrial assets within Johor continue to benefit from structural demand linked to cross-border trade and manufacturing expansion. With significant investment inflows into the region and limited availability of large-format facilities, assets of this scale are well-positioned to capture sustained tenant demand. In the current cycle, industrial segments are already showing early signs of repricing ahead of broader market recovery.

Johor Bahru - Commercial Shop Offices
Property Type: Commercial Shop Offices
Estimated Investment Value: ~RM 15 million
Estimated Yield: ~6%
Land Area (per unit): ~143 sqm
Built-up Area (per unit): ~228 sqm
Potential Portfolio Size: ~10 units
Notes:
A portfolio acquisition opportunity within a newly completed commercial shop office development located in one of Johor’s rapidly expanding commercial corridors. The development comprises modern two- to three-storey shop offices designed to support retail, food and beverage, and professional service businesses serving the surrounding residential catchment.
Strategically located within an established township with direct access to the North–South Expressway and proximity to Senai International Airport, the development benefits from strong connectivity to Johor Bahru and the wider Johor–Singapore economic region.
Investment Potential:
Neighbourhood commercial assets benefit from consistent, localised demand driven by surrounding population growth. In a stable macro environment, these assets offer accessible entry points with diversified tenant exposure. As broader sentiment improves, well-located retail and service-oriented assets may see gradual rental growth supported by increasing footfall and business activity.
Want to discuss any of these opportunities further? Reach out to our team directly:
Contact Information :
Petrus Yen - Managing Director
Petrus@fairhavenproperty.co.nz
Daarshan Kunasegaran
Daarshan.Kunasegaran@fairhavenproperty.co.nz
Disclaimer:
The property details, financial figures, and projections provided in this article are based on publicly available information and internal estimates. They are intended for informational purposes only and do not constitute financial advice or an offer to invest. Projections such as IRR and equity multiples are indicative only and subject to change based on market conditions, financing terms, and execution strategy. Interested parties should conduct independent due diligence and consult with a qualified advisor before making any investment decisions. Fairhaven Property Group accepts no liability for decisions made based on the information presented herein.