
There is a version of this year that most property investors had in their heads at the start of January. The Federal Reserve would cut rates. The RBNZ would keep easing. Inflation would settle. The signal to move would arrive, clearly and unmistakably, and then it would be time to act.
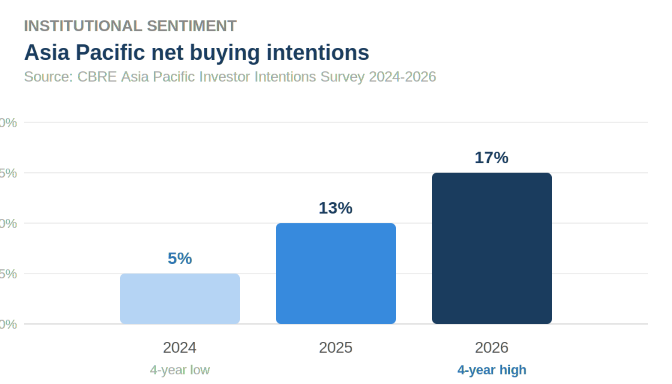
That version has not arrived. And while investors have been waiting for it, something else has happened. Institutional capital, pension funds, sovereign wealth funds, REITs, and private equity managers across Asia Pacific have returned to the market at the fastest pace in four years. Cross-border commercial real estate investment in the region hit its highest level since Q4 2021 in the first quarter of 2026 alone. Net buying intentions among institutional investors have climbed from 5% in 2024 to 13% in 2025 to 17% in 2026. The recovery did not wait for the all-clear signal. It started without one.
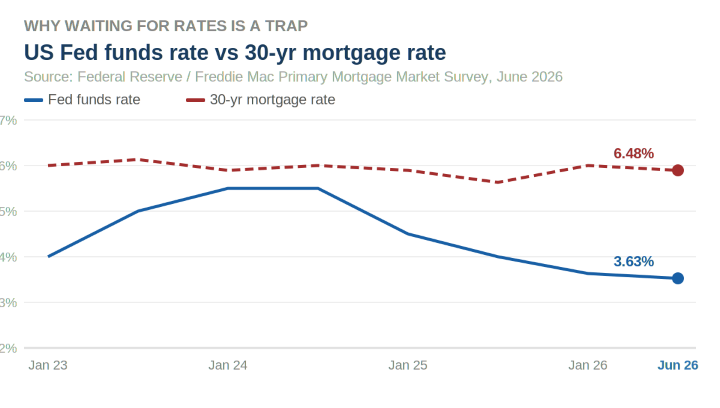
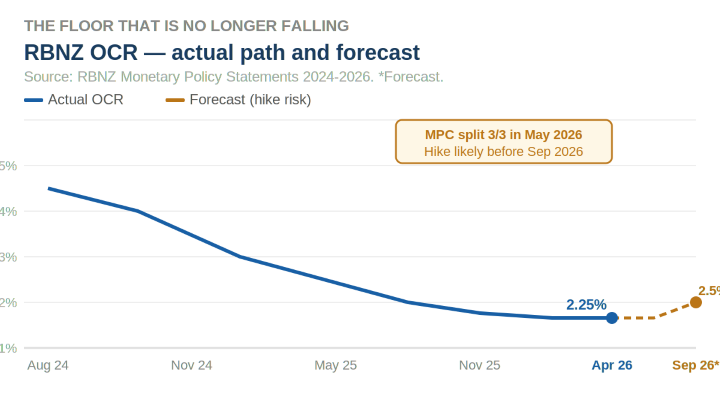
Meanwhile, the rate environment investors were hoping for has moved in the wrong direction. The 30-year US mortgage rate sat at 6.48% as of 4 June 2026. The RBNZ, which had cut the OCR to 2.25% through late 2025, held in April and is now signalling rate hikes before September, with its own June quarter inflation forecast sitting at 4.2%. The floor, in New Zealand at least, may already be behind us.
This edition covers:
Why the rate signal investors were waiting for has not arrived and is now moving against them in both the US and New Zealand
The institutional capital recovery already underway in Asia Pacific and what it means for timing
The specific window in Malaysia and the Johor corridor before a hard infrastructure catalyst closes the early entry opportunity
A grounded market update covering New Zealand, Malaysia, and the global macro context
What the cost of continued inaction looks like in concrete terms
1. The Rate Signal That Did Not Come
The thesis was reasonable enough. If central banks cut rates, borrowing costs fall, asset prices recover, and the entry point improves. The RBNZ cut the OCR by 325 basis points between August 2024 and November 2025, bringing it to 2.25%. The Federal Reserve cut three times at the end of 2025. The recovery appeared to be on track. Then the Middle East conflict changed the calculation.
In New Zealand, the RBNZ held the OCR at 2.25% in April 2026 after revising its June quarter inflation forecast up to 4.2%. The May 2026 Monetary Policy Committee meeting produced a three-to-three split resolved only by the Governor's casting vote. The RBNZ has since signalled that a hike is likely before September, with review dates on 8 July, 2 September, and 28 October 2026. The OCR floor may already be in.
In the United States, the Federal Reserve cut the federal funds rate to 3.50 to 3.75% through late 2025, but long-term rates have not followed. As of 4 June 2026, the 30-year fixed US mortgage rate averages 6.48% according to Freddie Mac. Mortgage rates are driven primarily by the 10-year Treasury yield and investor inflation expectations, not the Fed funds rate. With the US debt-to-GDP ratio above 125%, declining foreign demand for Treasuries, and oil-driven inflation elevated, long rates are sticky regardless of Fed action at the short end.
If rates do eventually drop to more accessible levels, every buyer currently on the sidelines will re-enter simultaneously, driving prices up through competitive demand. The investors who waited will end up paying more for the same assets than they saved on the cost of debt. This is not a hypothetical. It is the outcome that has played out in every rate cycle over the past three decades.
The investors who waited for rates to fall in New Zealand are now facing hikes. Those who waited for US mortgage rates to fall are still waiting at 6.48%. The signal did not come. The window they were waiting to open is starting to close.
2. The Recovery Nobody Announced
While private investors have been waiting for the signal to move, institutional capital has been moving.
According to MSCI's Asia Pacific Capital Trends report, commercial real estate transaction volumes across the region rose 22% year on year to USD 51.1 billion in Q1 2026. Cross-border investment hit its highest level since Q4 2021. CBRE found that 57% of regional investors intend to expand their property holdings in 2026. Net buying intentions climbed from 5% in 2024 to 13% in 2025 to 17% in 2026. REITs specifically recorded net buying intentions of positive 30%.
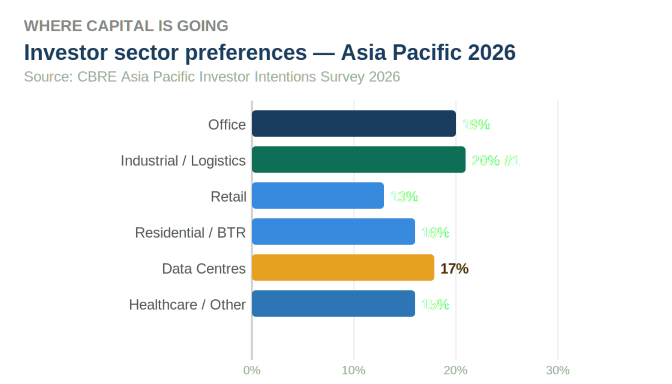
Core-plus and value-add strategies now dominate, accounting for over 60% of investor preferences. Investors are underwriting rental growth and durable income as the primary sources of return. Industrial and logistics assets remain firmly in focus, with roughly one in five investors specifically prioritising the sector. Data centres have gained significant traction as a distinct institutional allocation, now embedded in portfolio strategies across the region.
Morgan Stanley's April 2026 real estate market outlook states directly: geopolitical uncertainty is actively elevating real estate's appeal as an inflation hedge with durable income and long-term structural support. Institutional investors are raising more capital for real estate, while fewer are waiting to withdraw funds.
The institutional community's posture on Asia Pacific real estate changed between 2024 and 2026. Net buying intentions tripled. Transaction volumes hit four-year highs. Private investors watching from the sidelines saw caution in the headlines and missed the shift underneath them.

3. The Window Before the Train Arrives
There is a specific and time-bounded catalyst in the Malaysia story that changes the framing from a general thesis about market timing to a concrete deadline.
The Johor Bahru-Singapore Rapid Transit System Link is scheduled to open in January 2027, connecting Bukit Chagar station to Woodlands North MRT in Singapore in under six minutes. This is a bilateral commitment between Malaysia and Singapore, with construction confirmed and the completion timeline publicly reaffirmed. It sits within the broader Johor-Singapore Special Economic Zone established in January 2026, which has already attracted signed commitments from industrial, logistics, and technology operators across both economies.
Infrastructure of this kind reprices adjacent assets at completion, not at announcement. The period between confirmed completion and actual opening is historically the highest-return entry window, because the demand is already present in the data but the headline event that will trigger widespread retail investor attention has not yet occurred. Unsold property overhang in JB dropped 16% between 2022 and 2024. At the launch of one recent major Johor project, 30% of buyers were Singaporean, with most Malaysian buyers employed across the causeway.
Nomura Research has flagged robust demand for Malaysian industrial assets driven by increased FDI into the JS-SEZ. Maybank Investment Bank has maintained Malaysian industrial property as the key growth segment for 2026. The window is six months. January 2027 is not a distant horizon. The investors who are positioned before the opening will capture the repricing. Those who wait for confirmation will be buying into a market that has already adjusted.
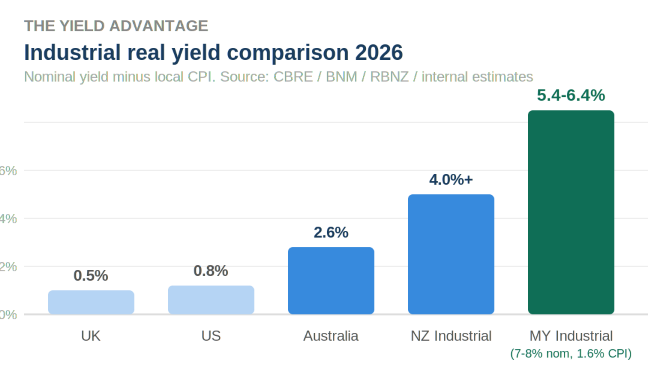
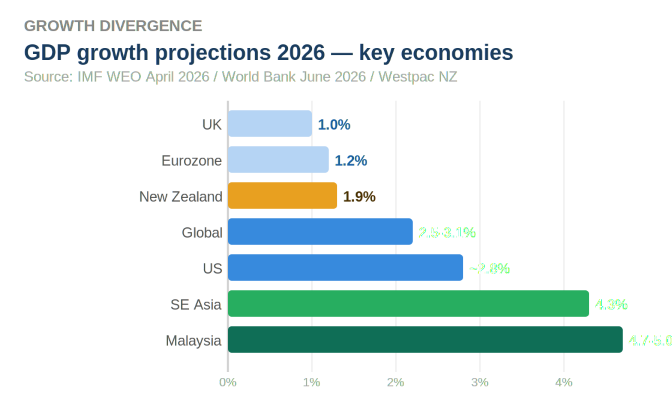
Beyond the RTS, Malaysia's macro foundation supports the broader thesis. GDP growth of 4 to 5% for 2026, inflation at approximately 1.6%, OPR steady at 2.75%, and real yields on industrial assets of 7 to 8% nominal produce a real return spread that developed markets cannot replicate. The Milken Institute ranked Malaysia 23rd globally and first in Southeast Asia for investment attractiveness in 2026.
4. Market Update: Where Things Stand in June 2026
The global macro backdrop in June 2026 is defined by divergence rather than synchronised movement. The World Bank's June 2026 Global Economic Prospects projects global growth at 2.5% in its adverse scenario, driven by Middle East conflict and sustained energy price disruption. Southeast Asia remains the clearest exception, maintaining 4.3% projected growth against a backdrop of global deceleration.
In the United States, the combination of sticky long-term rates, oil-driven inflation, and a new Fed chair appointment this month is creating a period of unusual policy uncertainty. Q1 2026 S&P 500 earnings growth came in at 27.8%, the strongest since Q4 2021, driven by Big Tech, but consumer confidence hit its lowest level since 2008 in early 2026. J.P. Morgan Global Research places a 35% probability on a US and global recession in 2026.
Europe continues to navigate a low-growth environment. The ECB postponed planned rate reductions after Dutch TTF gas benchmarks nearly doubled following the Middle East conflict. UK inflation is expected to breach 5% in 2026, with GDP growth at the bottom of consensus at approximately 1%.
In New Zealand, the RBNZ OCR sits at 2.25%, but the May MPC meeting produced a three-to-three split. The central bank's own June quarter inflation forecast is now 4.2%. The RBNZ has signalled a hike is likely before September. The easing cycle that had been supporting affordability and sentiment is not extending further. The OCR floor is behind us.
Within New Zealand, income-producing assets in structurally constrained segments continue to perform: industrial assets in South Auckland and Christchurch where vacancy sits below 3%, healthcare and essential services with long leases, and regional commercial assets at yields above 8% represent defensible positions that do not require macro recovery to generate returns.
Malaysia continues to operate from a position of structural strength. The combination of growth, low inflation, a stable monetary environment, and the infrastructure catalysts described in Section 3 produce a market where the fundamental case does not require either macro recovery or rate normalisation.

5. The Cost of the Sidelines
There is a tendency to frame inaction as a neutral position. Waiting does not feel like a decision. It feels like prudence, like patience, like the responsible posture of an investor who has not yet seen enough to act with conviction.
But inaction has a cost, and in the current environment, that cost is unusually concrete.
For investors waiting for the RBNZ to cut further before moving on New Zealand property, the data now points to hikes arriving before the end of the year. Every month of inaction from this point is a month where the borrowing cost environment is likely to worsen, not improve. The income being generated by a defensive industrial asset at 8% yield in South Auckland does not accrue to the investor on the sidelines.
For investors waiting for US mortgage rates to fall before considering cross-border allocation into Asia Pacific, the 30-year rate has been at or above 6.4% for most of 2026 despite Fed cuts. Waiting for that movement before acting is waiting for a transmission mechanism that is not functioning as expected.
For investors watching the Johor corridor thesis but waiting for confirmation, the RTS Link opens in January 2027. At that point, the event that was the entry thesis becomes the event that is already priced in. The six months between now and January 2027 are not a waiting period. They are the window.
Morgan Stanley's April 2026 real estate outlook described the current environment directly: the balance of risks and opportunities in real estate is shifting. Pricing discounts, improved debt access, and growing investor confidence are conditions that exist right now. The investors who capture this cycle are the ones who understood the data and moved while the opportunity still existed to move at current pricing.
Certainty is a lagging indicator. By the time the recovery is confirmed in the data and discussed widely in the press, the entry points that made the recovery worth capturing have already closed.
6. Featured Listings: Strategic Entry Points
The following assets reflect the core thesis of this edition: the recovery window is already open, institutional capital has already returned, and in certain geographies a specific infrastructure catalyst is six months from closing. Each listing sits within a segment where fundamentals are already aligned.
New Zealand
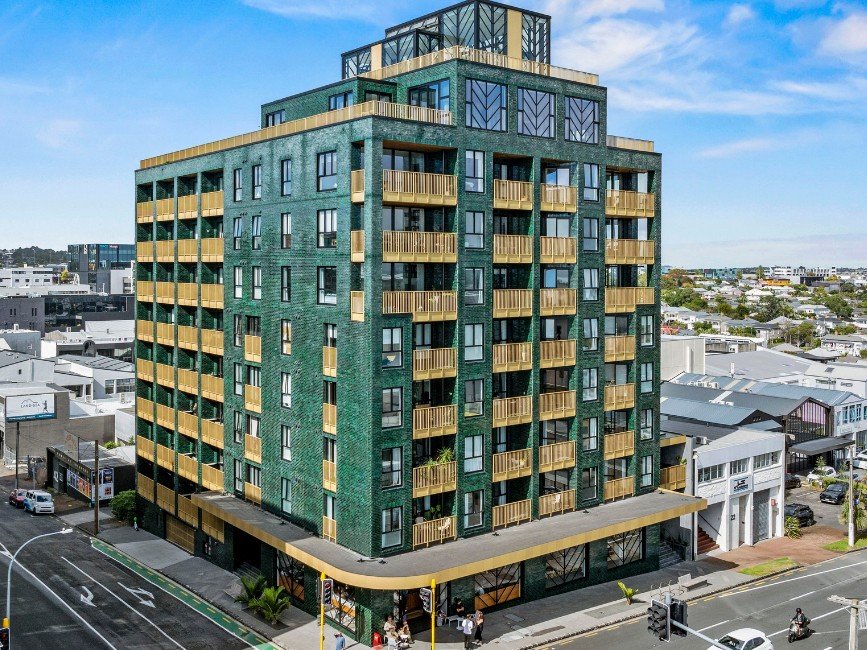
Auckland — Fully Leased Mixed-Use Retail Investment
Property Type: Retail / Hospitality, Mixed-Use
Estimated Value: ~NZD 3.5 million
Estimated Yield: ~5.5%
Floor Area: ~313 sqm
Tenancy: 2 tenancies, 100% occupied
Notes:
A fully leased ground-floor retail and showroom asset within a recently completed, award-winning mixed-use development in the Auckland city fringe. The property occupies a prominent corner position within a high-density residential precinct, anchored by an established all-day hospitality operator on a 6-year lease with fixed annual rental increases and multiple renewal rights. A secondary tenancy adds diversified income across showroom and professional office use. The building is finished to a high standard with over four metres of stud height and significant natural light frontage.
Investment Potential:
The Auckland city fringe mixed-use corridor is one of the most structurally resilient segments of the NZ commercial market, supported by high residential density, consistent pedestrian demand, and the non-discretionary nature of neighbourhood hospitality and professional services. In a market where broad commercial sentiment remains cautious, a fully leased asset anchored by an established operator with a long lease and fixed escalations provides exactly the income visibility that the current cycle rewards. The property is not dependent on market recovery to perform. It is generating income today, at a yield level that reflects current pricing without requiring a rate cut to justify entry.
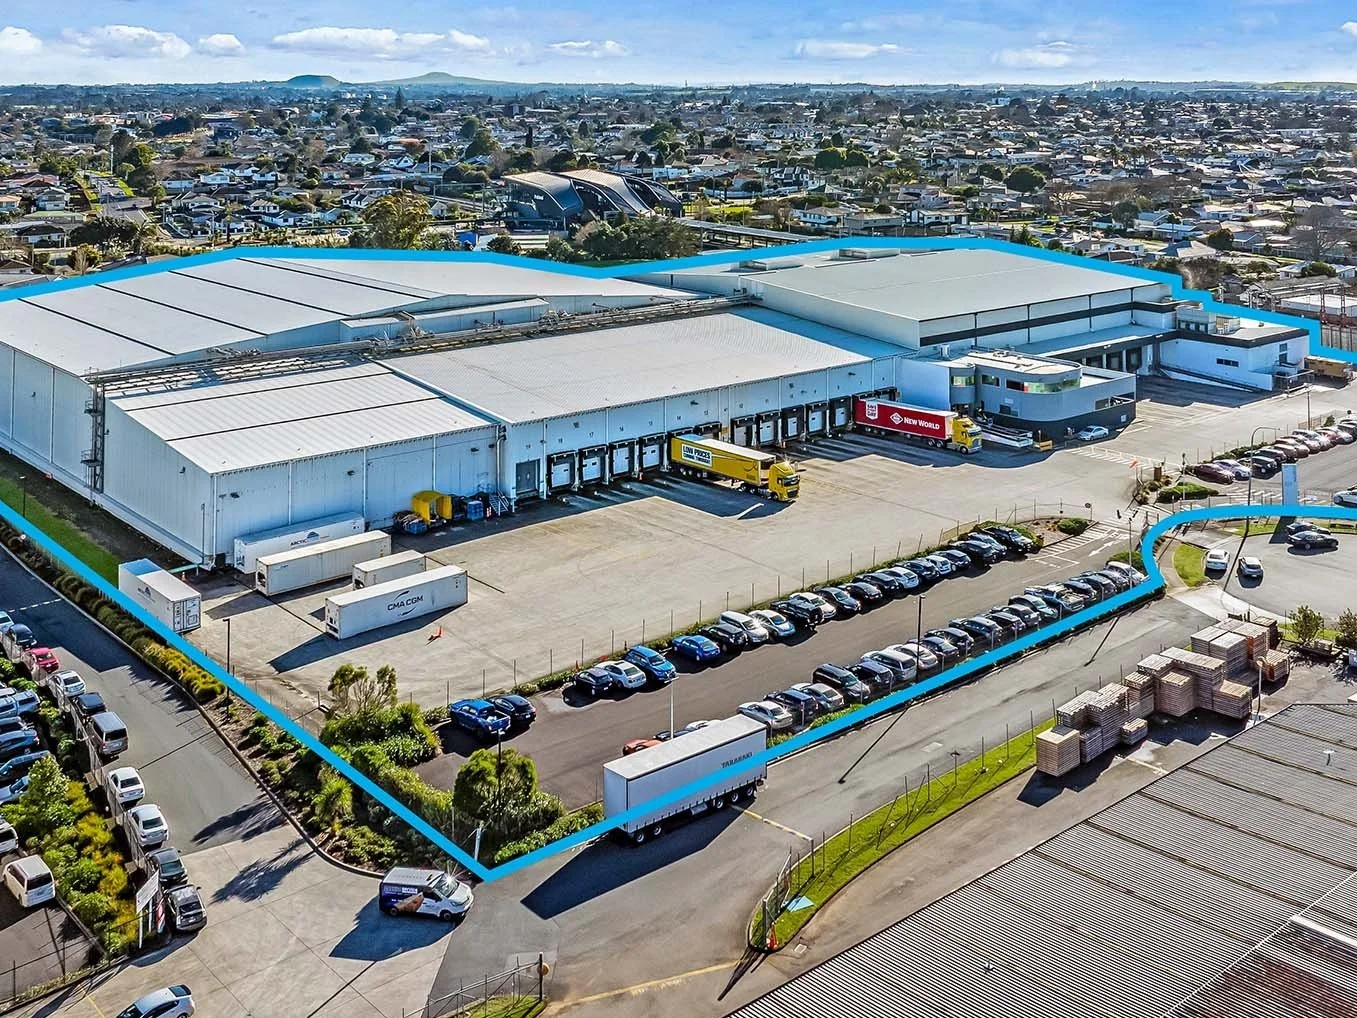
Auckland (South) — Cold Storage and Logistics Facility
Property Type: Industrial / Cold Storage and Distribution
Estimated Value: ~NZD 60 million
Estimated Yield: ~7.5%
Land Area: ~46,000 sqm (Freehold)
Building Area: ~16,000 sqm
Site Coverage: ~34% (significant development optionality)
Notes :
A significant chilled and frozen distribution facility in Auckland's most established southern industrial precinct, offering exceptional connectivity to the motorway network, Auckland Airport, and the Port of Auckland. The asset is currently leased to a major national grocery operator, providing secure income in the near term. The large freehold site with low site coverage creates meaningful optionality for future expansion or staged redevelopment alongside the existing income stream.
Investment Potential:
Cold storage infrastructure in New Zealand is among the most structurally undersupplied segments of the industrial market. The cost and complexity of replicating a facility of this scale and specification from scratch creates a durable floor under existing asset values, regardless of broader sentiment conditions. The near-term lease expiry is not a risk but an active opportunity: the ability to reset to current market rents in a precinct where cold chain vacancy is effectively zero, or to reposition for a new long-term operator at a substantially improved rental base. For investors operating within the income-first framework appropriate to the current NZ cycle, this asset represents a rare combination of covenant-grade income today and material value-add optionality on a short horizon. The freehold land holding at this scale, in this location, is a finite asset that does not come to market often.
Malaysia
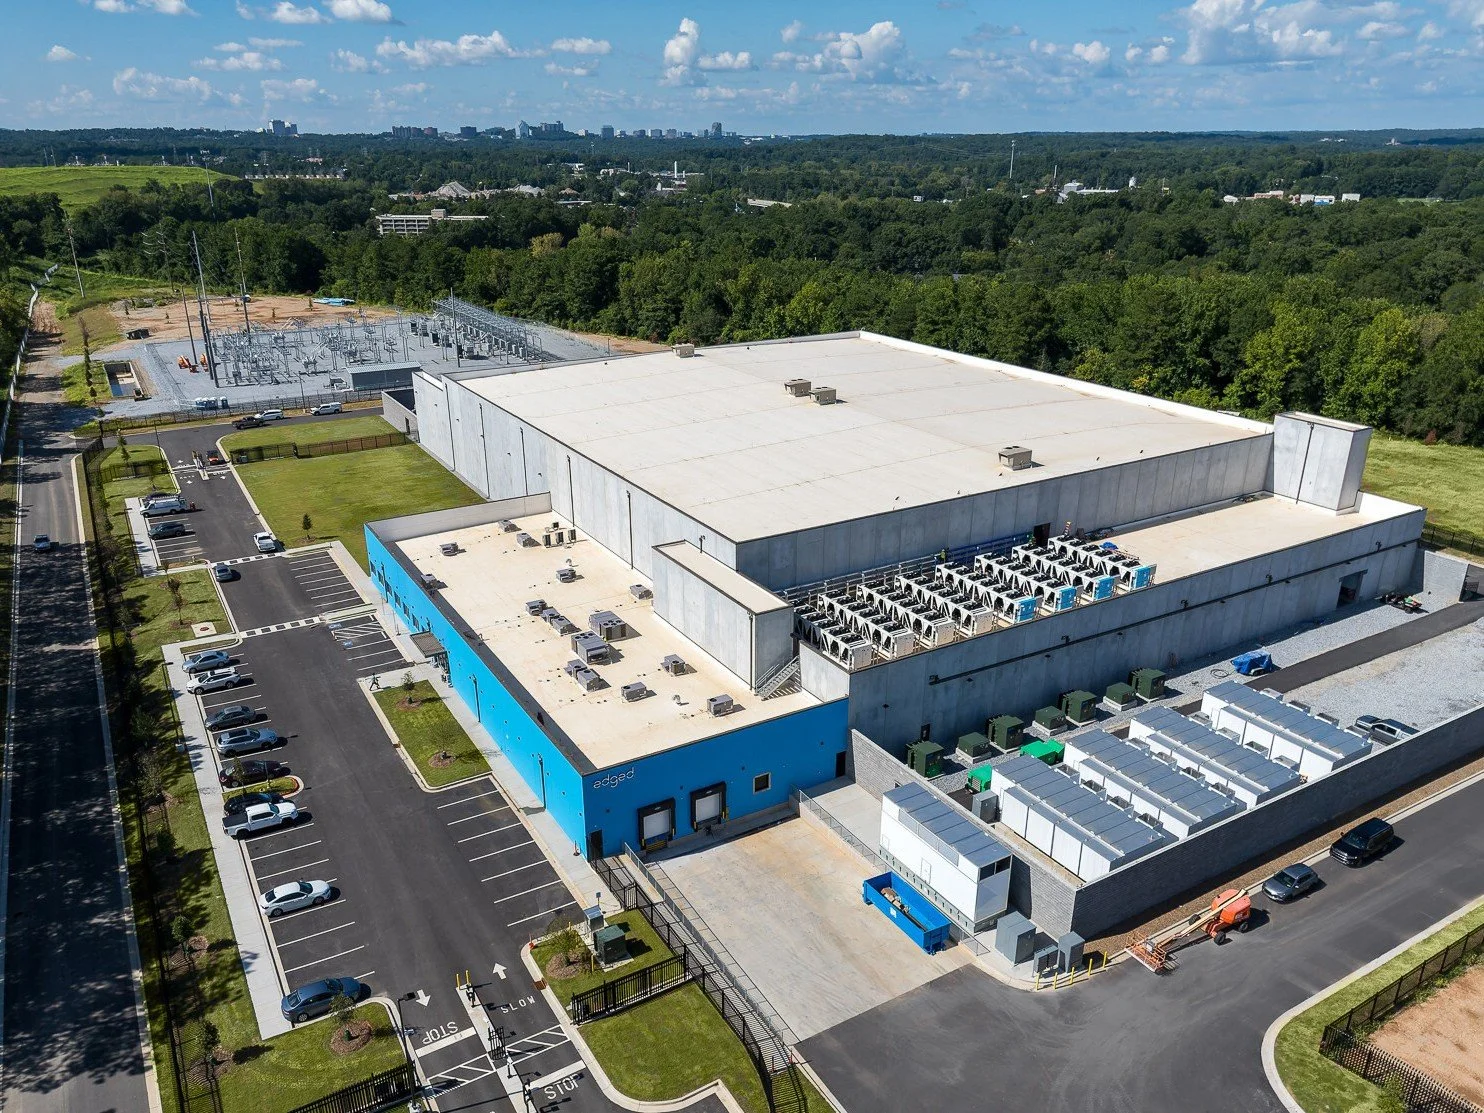
Shah Alam, Selangor — Data Centre Ready Industrial Facility
Property Type: Detached Industrial / High Power Infrastructure
Estimated Value: ~RM 38M
Estimated Yield: ~7.5%
Land Area: ~65,000 sqft
Floor Area: ~48,000 sqft
Power Supply: ~2,000 Amp / TNB substation on title
Notes:
A recently upgraded industrial facility in Shah Alam's Section 26 industrial zone, configured for high-power operational tenants including light data infrastructure, semiconductor assembly, and precision manufacturing. The facility sits within 2km of three active data centre campuses and directly adjacent to an established logistics corridor serving Port Klang.
Investment Potential:
Investment Potential: Shah Alam is emerging as the overflow corridor for Klang Valley's data centre demand, as Cyberjaya and Subang have limited remaining land at viable costs. The 2,000 amp power supply on title, rare in the sub-RM 50M industrial segment, makes this asset immediately attractive to a tenant pool that would otherwise require 18-plus months of infrastructure lead time. This ties directly to the article's infrastructure thesis: owning high-power industrial stock before hyperscale operators exhaust the primary corridors means entering ahead of the repricing.
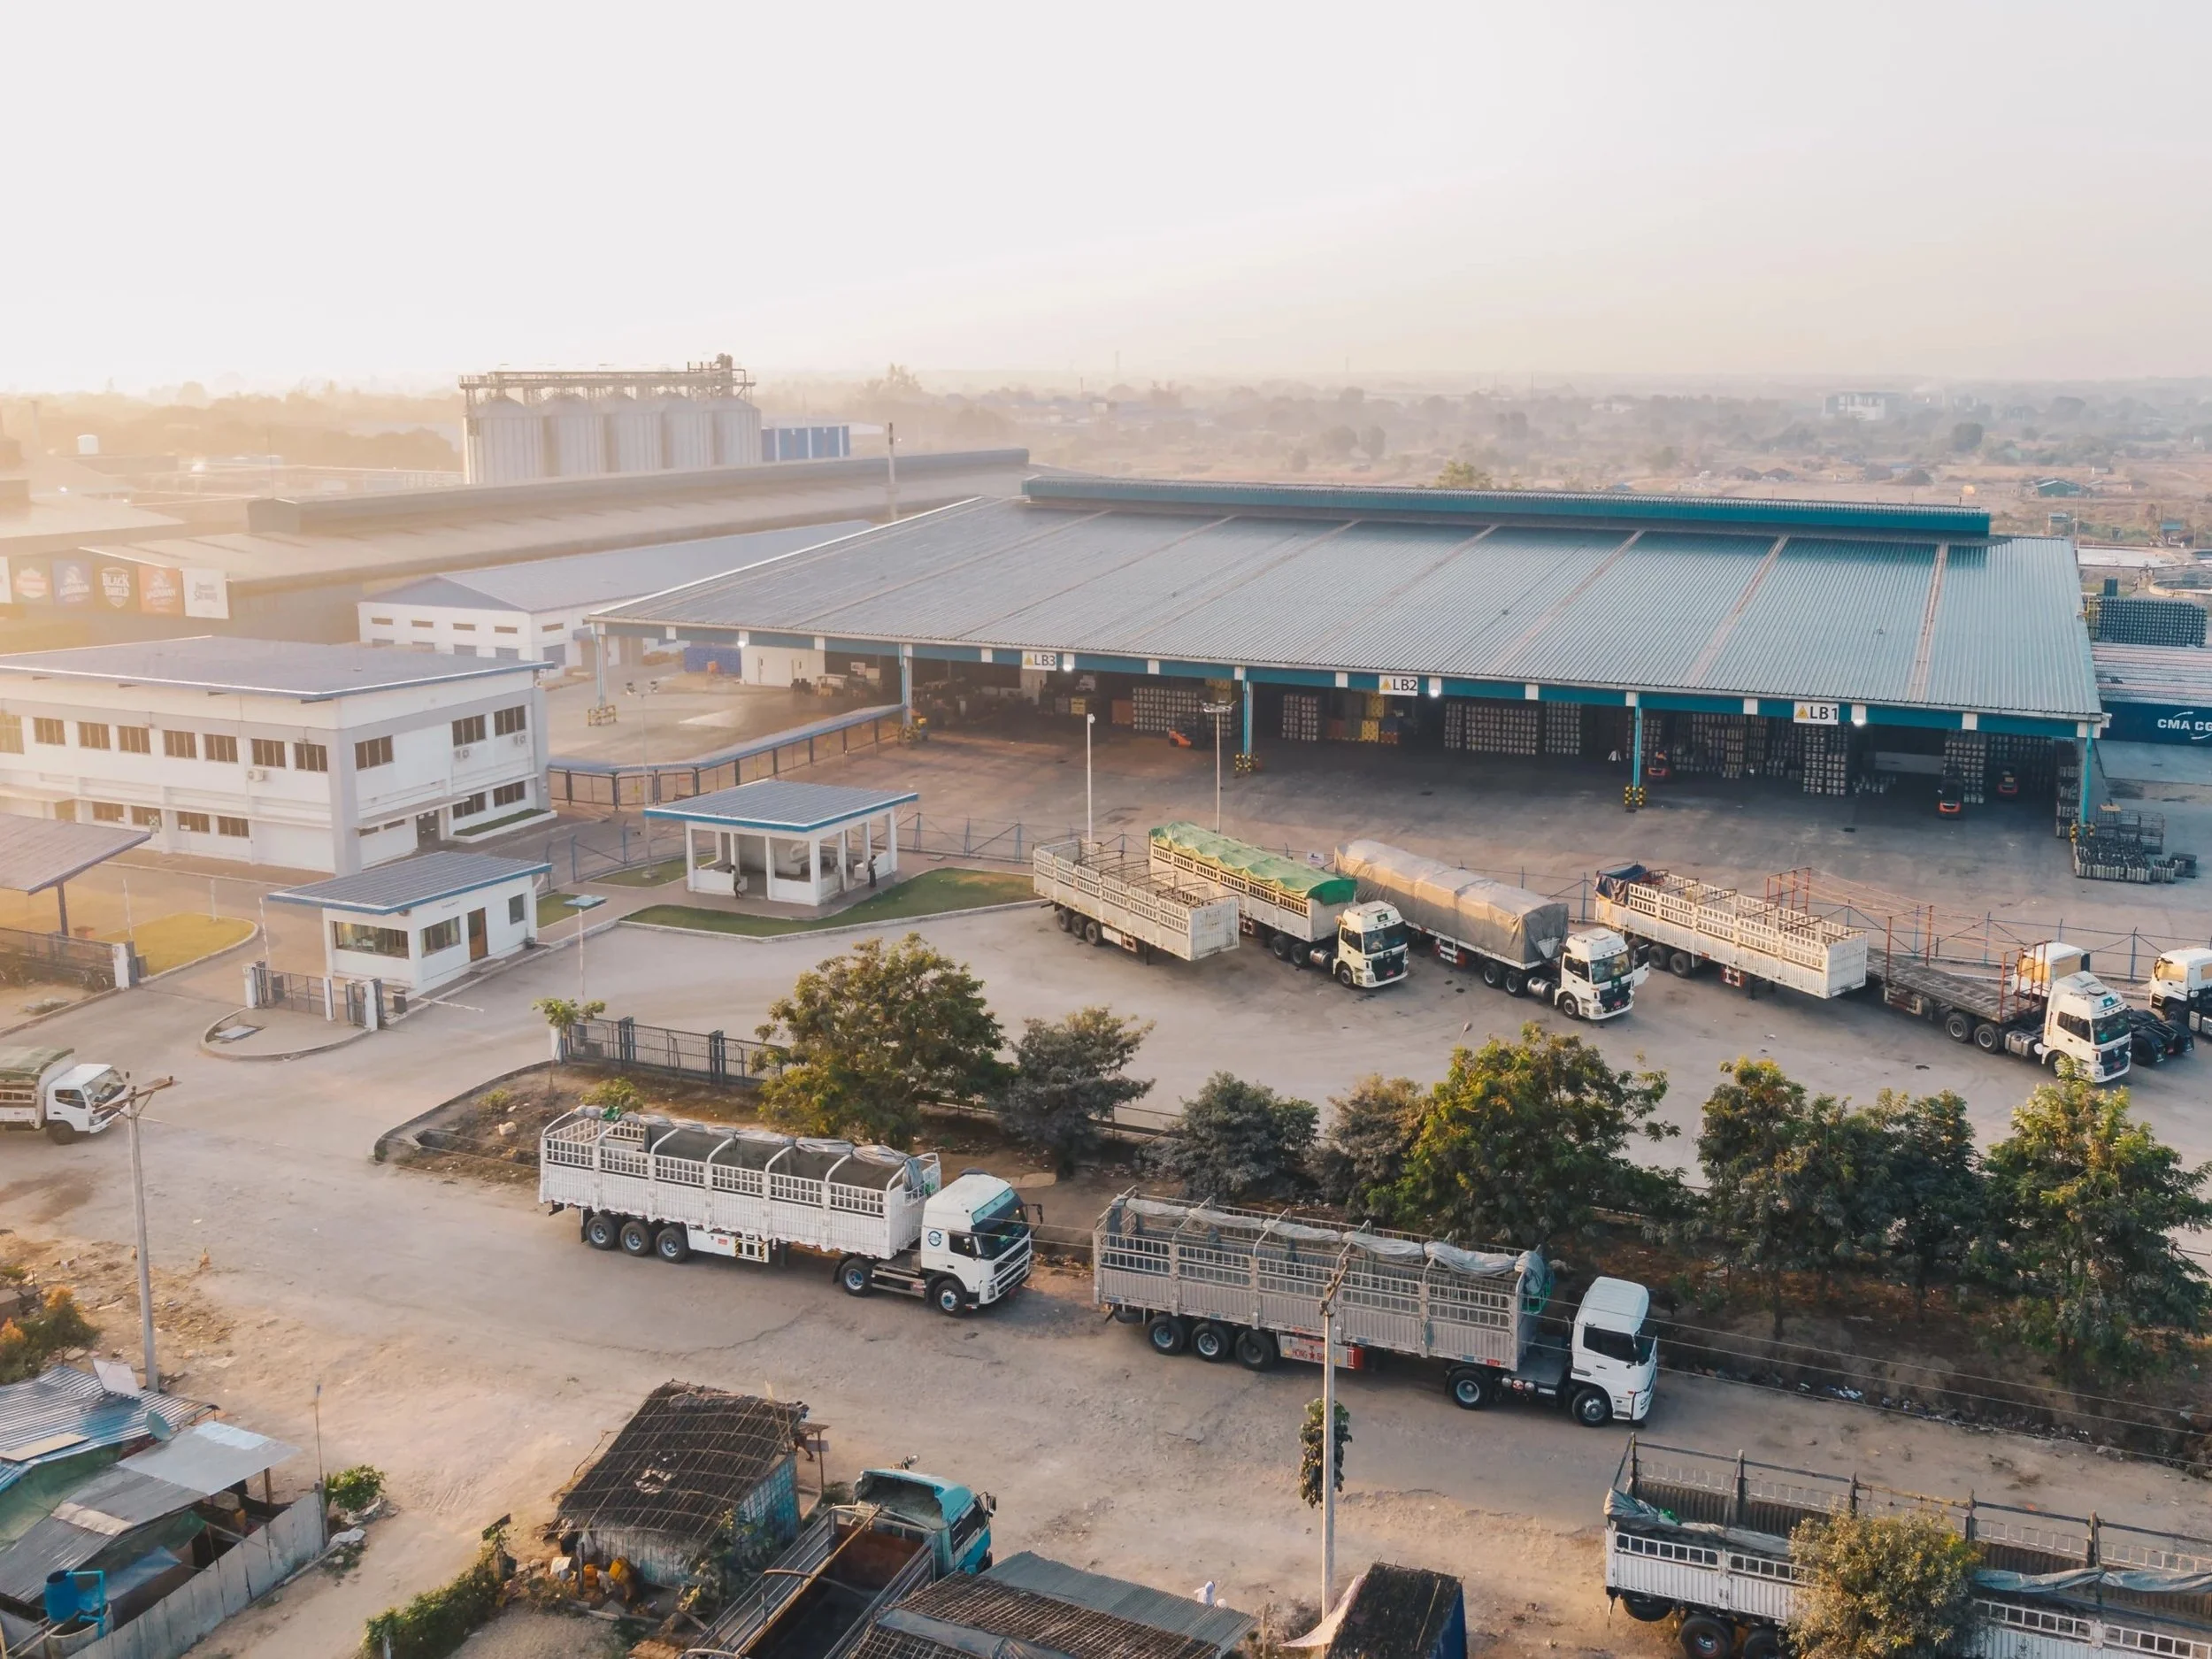
Johor Bahru (Kulai) — Logistics Hub, Freehold Industrial
Property Type: Single-Tenanted Logistics Warehouse
Estimated Value: ~RM 28M
Estimated Yield: ~7.8%
Land Area: ~120,000 sqft
Floor Area: ~85,000 sqft
Tenure: Freehold
Notes:
A large-format freehold logistics warehouse in Kulai, 30km north of Johor Bahru city and directly accessible from the North-South Expressway. Currently tenanted to a regional e-commerce fulfilment operator on a 5-year lease with a rental escalation clause. Ceiling height of 10 metres, 6 loading docks, and a full truck yard.
Investment Potential:
Kulai is one of the Johor corridor's most active logistics zones due to its midpoint position between JB Port and Kuala Lumpur's distribution network, and its positioning just outside the premium land pricing of the SiLC and Nusajaya zones. The freehold title, large format, and 5-year lease to a logistics operator tied to Southeast Asia's e-commerce growth provide exactly the income visibility and exit liquidity profile described in the article. As the Johor-Singapore SEZ drives further manufacturing and trade activity northward along the corridor, Kulai assets are structurally well placed to absorb tenant overflow from tighter southern markets.
Want to discuss any of these opportunities further? Reach out to our team directly:
Contact Information :
Petrus Yen - Managing Director
Petrus@fairhavenproperty.co.nz
Daarshan Kunasegaran
Daarshan.Kunasegaran@fairhavenproperty.co.nz
Disclaimer:
The property details, financial figures, and projections provided in this article are based on publicly available information and internal estimates. They are intended for informational purposes only and do not constitute financial advice or an offer to invest. Projections such as IRR and equity multiples are indicative only and subject to change based on market conditions, financing terms, and execution strategy. Interested parties should conduct independent due diligence and consult with a qualified advisor before making any investment decisions. Fairhaven Property Group accepts no liability for decisions made based on the information presented herein.